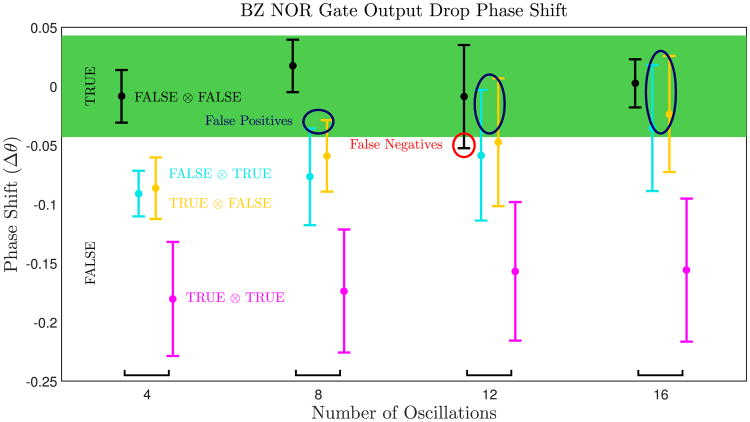
Fig. 6.
The phase shift (Δθ) of an output droplet for each possible input measured as a function of the number of times the droplets in an experiment have oscillated. Error bars mark one standard deviation above and below the mean phase shift. Phase shifts close to 0 indicate that there has been no perturbation from a TRUE input, so the output is TRUE. Phase shifts of greater magnitude indicate a FALSE output. Sometimes a TRUE input will not produce a large enough phase shift and the output will remain TRUE, resulting in a false positive. Other times due to changes in the period of oscillation of a droplet over time it will appear to have a large phase shift even though both inputs are FALSE, resulting in a false negative. Both of these cases are visible in this plot when the error bars for a particular input cross into the region indicating the incorrect output. However, most of the error bars correspond to the expected output for a given input, demonstrating that our NOR gates function correctly.

