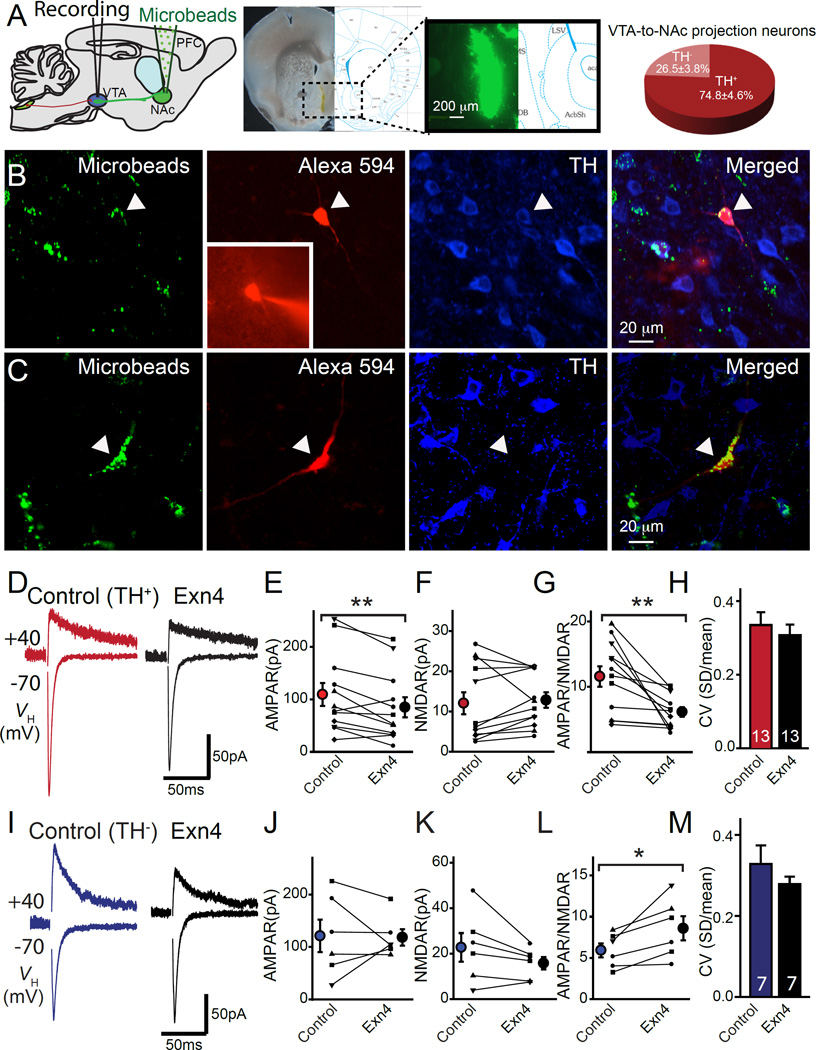
Figure 3. Exendin-4 (Exn4) suppresses excitatory synaptic strength of dopaminergic VTA-NAc neurons.
(A) Left panel: Schematic illustration of stereotaxic injection of fluorescent microbeads in NAc. Middle: Representative image of NAc injection site. Right panel: Statistical distribution of TH+ and TH− VTA-to-NAc medial shell projecting neurons. (B) Confocal images of recorded retrograde labeled neurons in VTA that were labeled with Alexa 594 post-hoc immunostained for tyrosine hydroxylase (TH). (C) Representative confocal image of a non-DA (TH−) VTA-to-NAc projecting neuron. Green=microbeads, red=Alexa 594, blue=TH. (D) Sample AMPAR and NMDAR response at +40mV from DA VTA-to-NAc neurons before (red) and after (black) bath application of Exn4. (E-H) Statistical results of AMPAR (E), NMDAR (F), AMPAR/NMDAR (G), and coefficient of variation (H), from evoked recordings of TH+ VTA-to-NAc projecting neurons (n=13). (I) Sample AMPAR and NMDAR response at +40mV from non-DA (TH−) VTA-to-NAc neurons before (blue) and after (black) bath application of Exn4. (J-M) Statistical results of AMPAR(J), NMDAR (K), AMPAR/NMDAR (L), and coefficient of variation (M) (n=7), from evoked response recordings of non DA VTA-to-NAc projection neurons (n=7). All values represent mean ± SEM. Note that paired t-tests were used to define the statistical significances. *p<0.05, **p<0.01.

