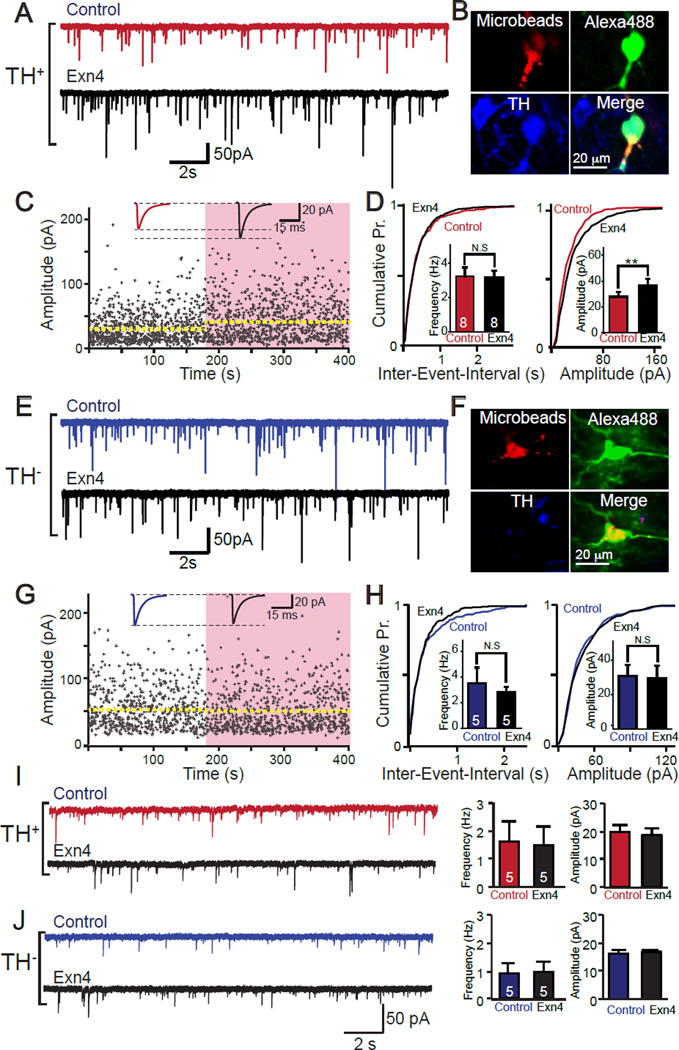
Figure 5. Effects of Exendin-4 (Exn4) on VTA-NAc neuron response to inhibitory inputs.
(A) Sample recordings of TH+ neurons before and after bath application of Exn4. (B) Confocal images of representative TH+ VTA-NAc recorded neuron labeled with microbeads from NAc (upper left) or Alexa 488-biocytin from recording electrode (upper right) and immunostained for tyrosine hydroxylase (TH, lower left). (C) sIPSCs amplitude of TH+ VTA-NAc neurons, before (white) and after (pink shaded area) bath application Exn4, top trace showing the average trace of events before (red) and after (black) application of Exn4. (D) Statistical results of sIPSC recordings from (A)(n=8). (E) Sample recordings of TH− neurons before and after bath application of Exn4. (F) Confocal images of representative TH− VTA-to-NAc projecting neurons recorded that were labeled with retrobeads from NAc (upper left) and Alexa 488-biocytin from recording electrode (upper right) and immunostained for tyrosine hydroxylase (TH, lower left). (G) sIPSCs amplitude of TH− VTA-NAc neurons before (white) and after (pink shaded area) bath application of Exn4 (top trace showing the average trace of events before and after application of Exn4). (H) Statistical results of sIPSC recordings from (E) (n=5). (I &J) Impact of Exn4 on mIPSCs in TH+ VTA-to-NAc projecting neurons (I) and TH− VTA-to-NAc projection neurons (J). Left panel: representative traces before and after Exn4; Right Panel: pooled data of average frequencies and amplitudes of mIPSCs (n=5 in both groups). Data are presented as mean ± SEM. Note that paired t-tests were used to define the statistical significances. **p<0.01.

