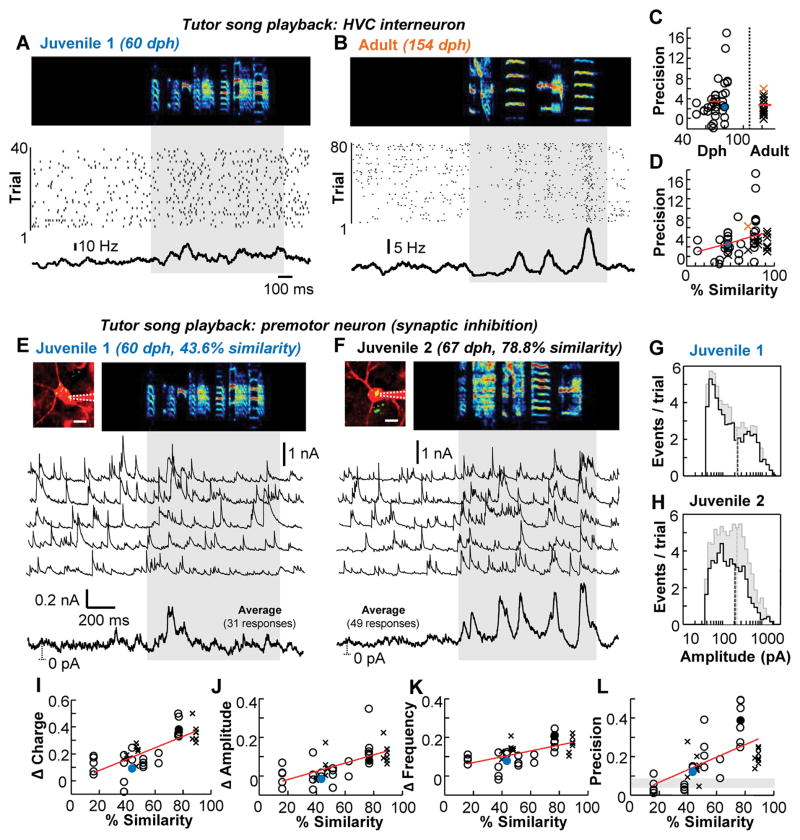
Figure 2. Tutor song-evoked inhibition strengthens and sharpens with improved song performance.
(A and B) Awake spiking activity of example HVC interneurons recorded in a juvenile (A) and an adult (B) bird during silence and tutor song presentation. (C) Across the population, the precision of HVC interneuron firing did not differ between juveniles (3.8±4.0Hz) and adults (2.9±1.7 Hz) (P = 0.51, Wilcoxon rank sum test). (D) Spiking precision of HVC interneurons depending on performance (P = 0.056, linear mixed-effect model). The filled circles/colored crosses represent data shown in the examples to the left. (E and F) Awake voltage-clamp recordings of inhibitory currents onto two HVC premotor neurons (images at top, scale bar: 10 μm) in response to a tutor song. For each cell, five single sweeps are presented as well as an average. The dotted line represents the distance from baseline (0 pA). (G and H) Amplitude histograms of detected inhibitory events during silence (black) and tutor song (gray) for juveniles 1 (G) and 2 (H). Mean of the amplitude distribution is indicted as a dotted vertical line. (I to L), Changes in tutor-song evoked inhibition onto HVC premotor neurons as a function of performance. Increasing similarity to the tutor song is associated with an increase (P < 0.01, linear mixed-effect model) in the inhibitory charge (I), the amplitude (J) and frequency (K) of inhibitory events, and the precision of inhibition across trials (L) (shaded region = 95% confidence interval). The filled circles represent data shown in the examples above.

