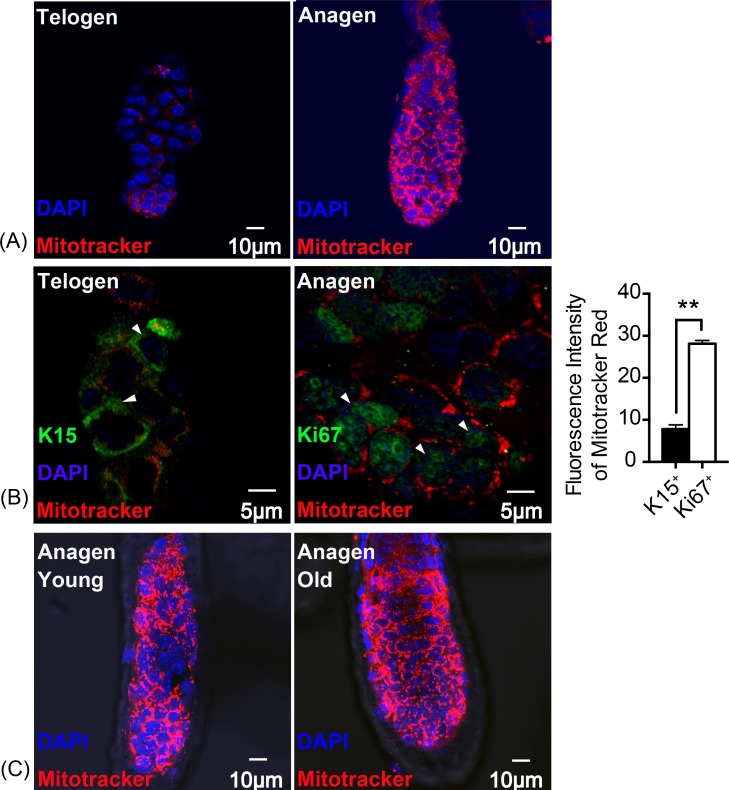
Figure 2. Mitochondrial activity is increased in anagen proliferating matrix cells.
Fluorescence intensity of Mitotracker Red was detected to measure mitochondrial activity. (A) More mitochondria and a higher mitochondrial activity were detected in anagen matrix cells than in telogen bulge cells. (B) Mitochondrial activity was significantly elevated in Ki67+ proliferating cells than in K15+ stem cells (∗∗, P < 0.01). (Markers flagged by white arrows) (C) Mitochondria in matrix cells were of same activity levels due to in different aged mice. (A, B) Data show a complication of 3 experiments (n = 3 mice per group, with two 5 mm × 5 mm sections per mouse). (C) Data show a complication of 3 experiments (n = three 8 week-old mice (young group) and three 2 year-old mice (old group) per experiment, with two 5 mm × 5 mm sections per mouse).

