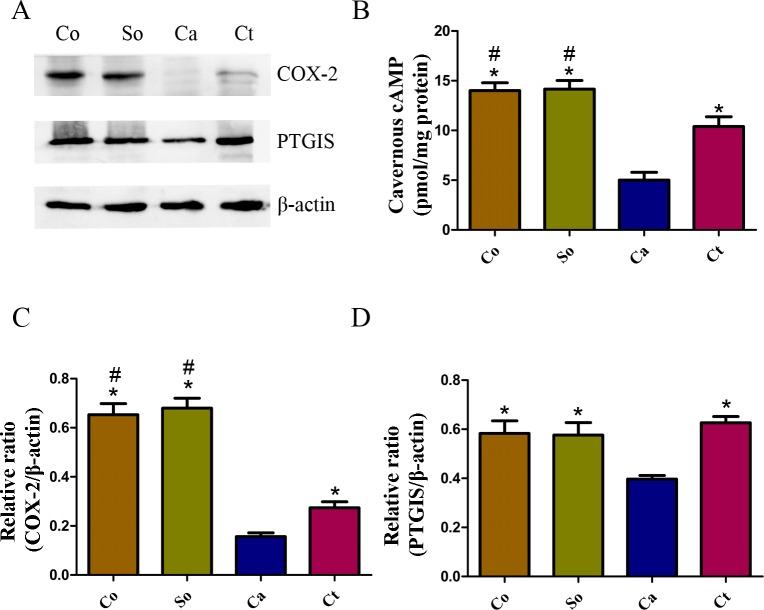
Figure 4. Testosterone-induced increase in the COX-2/cAMP signaling pathway in penile tissue.
(A, C, D) Typical western blot showing COX-2 and PTGIS protein expression normalized to β-actin. (B) The cAMP concentration was detected in the penile tissue. The data are expressed as the mean ± SD (n = 6 ∼ 8 rats/group). Co, control; So, sham-operated; Ca, castration; Ct, castration-with-testosterone-replacement. ∗p < 0.05 vs. the castration group; #p < 0.05 vs. the castration-with-testosterone-replacement group.

