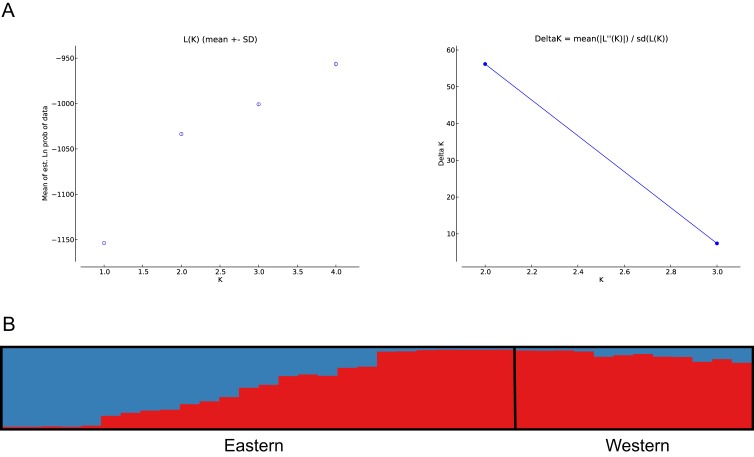
Figure 4. Bayesian clustering analysis based on STRUCTURE.
(A) The most likely number of clusters (K = 2) detected with the U. arctos samples collected in the Cantabrian Mountains expressed as the mean likelihood (log P(D)), and ΔK. (B) Representation of the average proportions of memberships (Q) in each of the K = 2 inferred clusters. The colours used correspond with the geographic origin of the individuals sampled depicted in Fig. 1.

