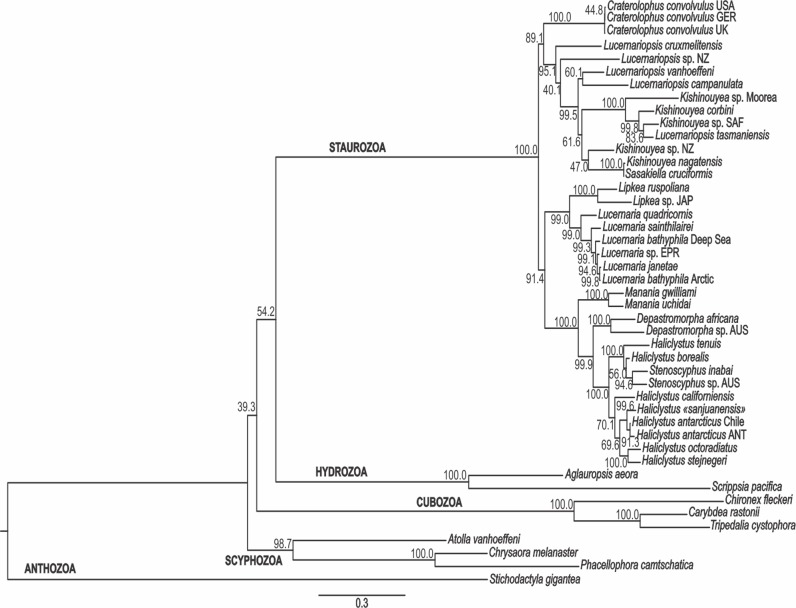
Figure 4. Maximum likelihood phylogenetic hypothesis.
Analysis based on combined data of mitochondrial markers COI and 16S, and nuclear markers ITS, 18S (SSU), and 28S (LSU). Bootstrap indices under maximum likelihood at each node. ANT, Antarctica; AUS, Australia; EPR, East Pacific Rise; GER, Germany; JAP, Japan; NZ, New Zealand; SAF, South Africa; UK, the United Kingdom; USA, the United States of America.

