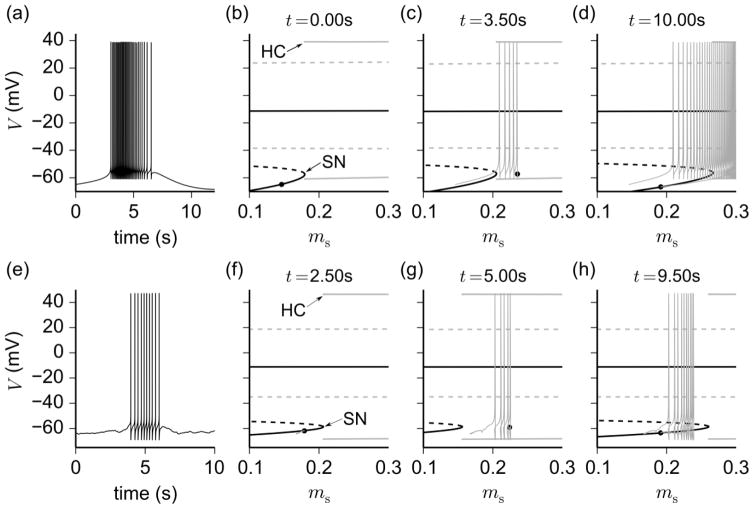
Fig. 8.
Slow-fast subsystem analysis of the parabolic and irregular bursters as determined by the bifurcation diagrams of membrane potential V with respect to slow variable ms (treated as a parameter). The subplots in each row from left to right are the voltage time series of one burst cycle ((a), (e)), and the bifurcation diagrams of the parabolic and stochastic bursting models ((b)–(d),(f)–(h)). The latter show branches of (un)stable steady states, represented by thick (dashed) solid black lines, and branches of (un)stable periodic orbits, represented by thick (dashed) solid gray lines that depict the peaks and nadirs of these orbits. Superimposed on the bifurcation diagrams are the full model trajectory in the V − ms plane of the selected burst cycle up to time t (thin solid gray line), along with the phase point (black dot) at time t (specified by the legend on top of (b)–(d),(f)–(h)). Other slow variables (h2,HVA and Ca) are treated as parameters and assigned the values they attain at the phase points t. In each row, the leftmost bifurcation diagrams ((b),(f)) are computed with values of the slow variables taken during the initiation phase of the burst (i.e., before the upstroke of the first spike), the middle diagrams ((c),(g)) during active phase, and rightmost diagrams ((d),(h)) during the termination phase (i.e., after the downstroke of the last spike)

