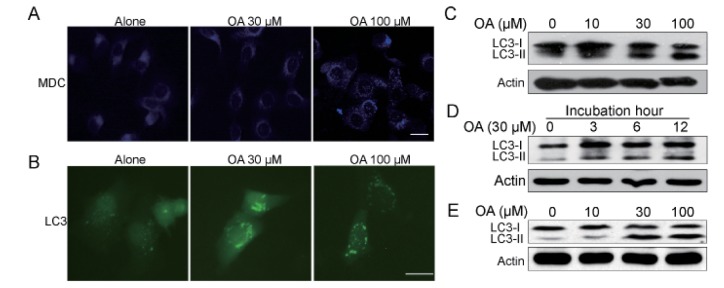
Fig. 2. Oleanolic acid induced evident autophagy in HepG2 cells.
(A) HepG2 cells were treated with 100 µM OA for 12 h and then incubated with 0.05 mM monodansylcadaverine (MDC) for 10 min. Cells were then analyzed by fluorescence microscopy. Scale bar: 5 µm. (B) HepG2 cells transfected with GFP-LC3 cDNA were treated with 100 µM OA for 12 h. The formation of vacuoles containing GFP-LC3 (dots) was examined by fluorescence microscopy. Scale bar: 5 µm. (C, D) Protein expression of LC3 in HepG2 cells. (C) HepG2 cells were cultured with indicated concentrations of OA for 24 h. (D) HepG2 cells were cultured with 30 µM OA for 3 h, 6 h, 12 h. (E) SMC7721 cells were cultured with indicated concentrations of OA for 24 h. The results shown are representative of three different experiments.

