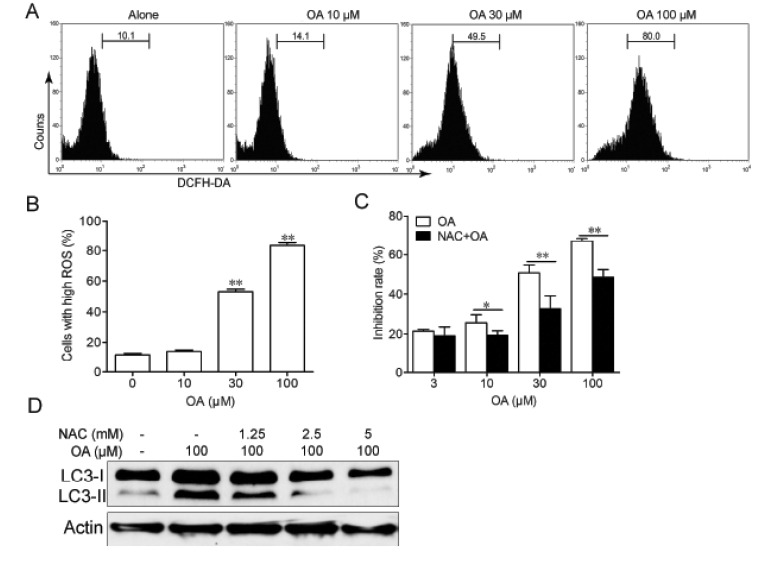
Fig. 5. Autophagy induced by OA in HepG2 cells was ROS-dependent.
(A, B) HepG2 cells were treated with indicated concentrations of OA for 12 h and stained with DCFH-DA and analyzed by flow cytrometry. (C) HepG2 cells were treated with indicated concentrations of OA for 24 h in the presence or absence of 5 mM NAC and cell death was measured by MTT assay. *p<0.05, **p<0.01. (D) HepG2 cells were treated with 100 µM OA for 12 h in the presence or absence of indicated concentrations of NAC and expression of LC3 was examined by western blot. The results shown are representative of three different experiments.

