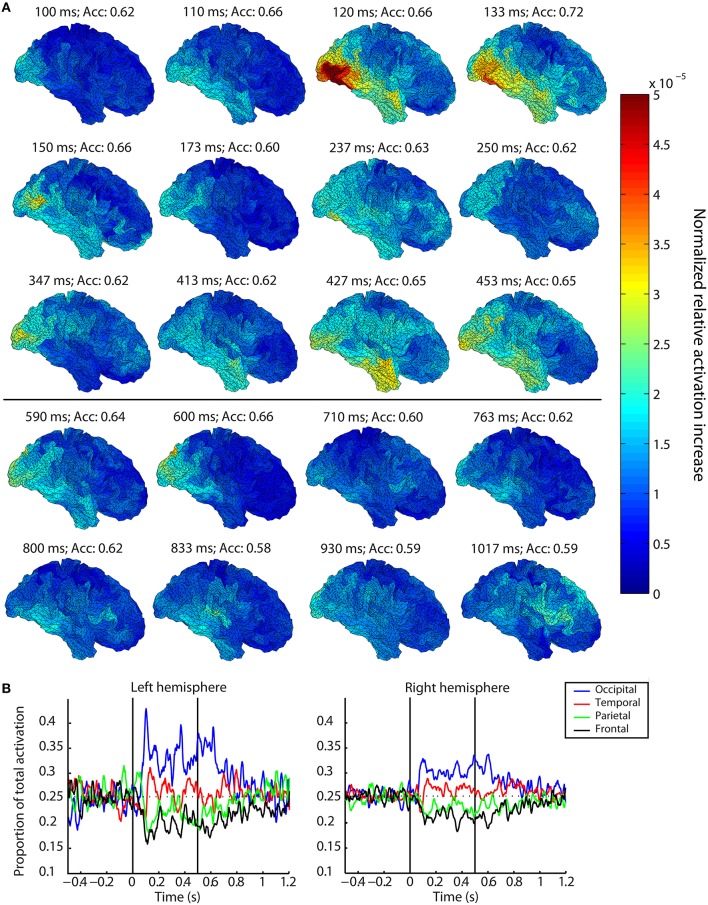
Figure 2.
Spatiotemporal dynamics of visual perception. (A) Localization of activation patterns at selected time points for the right hemisphere averaged over subjects. Warmer colors indicate a larger average normalized relative increase in activation compared to baseline. Areas with large values contain information about the identity of the perceived or remembered stimulus. Figures above the black horizontal line correspond to time points during stimulus presentation, figures below this line belong to time points after stimulus offset. (B) Smoothed traces of the proportion of total averaged normalized relative activation originating from each lobe over time. The first black vertical line indicates stimulus onset, the second line coincides with stimulus offset. The horizontal dashed line indicates 0.25, which indicates an equal distribution of activation for the four lobes.

