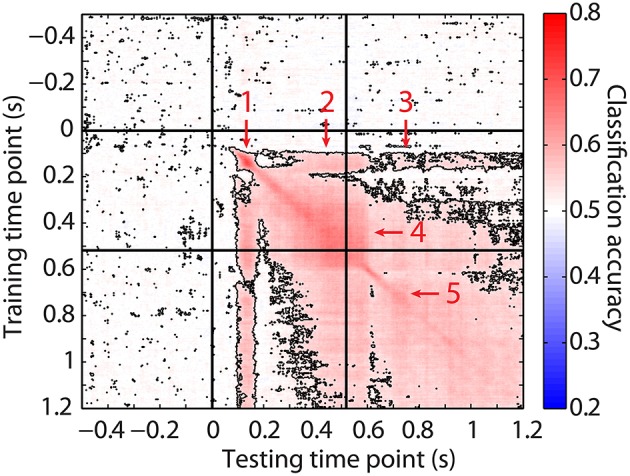
Figure 3.

Transfer learning results. Average accuracies obtained when classifiers were trained on the MEG signal at the time points on the y-axis, and tested on signals at the time points on the x-axis. Higher accuracies were marked as more red. Outlined accuracies were significantly higher than the averaged accuracies obtained from transfer learning on time points between 300 and 100 ms before stimulus onset (FDR-corrected). The left vertical and upper horizontal line indicate stimulus onset. The right vertical and lower horizontal line indicate stimulus offset. Arrows indicate different blocks of transfer learning that are elaborated on in the text.
