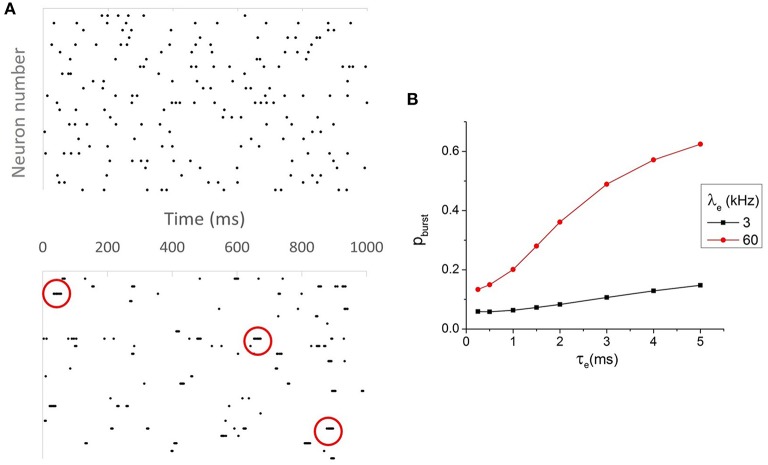
Figure 3.
(A) Raster plot for neurons with τe = 0.5 ms and τeff ≈ 6.5 ms (top) and τe = 4 ms and τeff ≈ 0.37 ms (bottom). Neurons with small τe and large τeff almost never fire bursts, while their counterparts with large τe and small τeff burst frequently. The red circles mark some of the instances of burst firing. (B) The prevalence of burst firing. Neurons with large τe and large λe (or small τeff) fire most frequently, as measured by pburst.

