Figure 4.

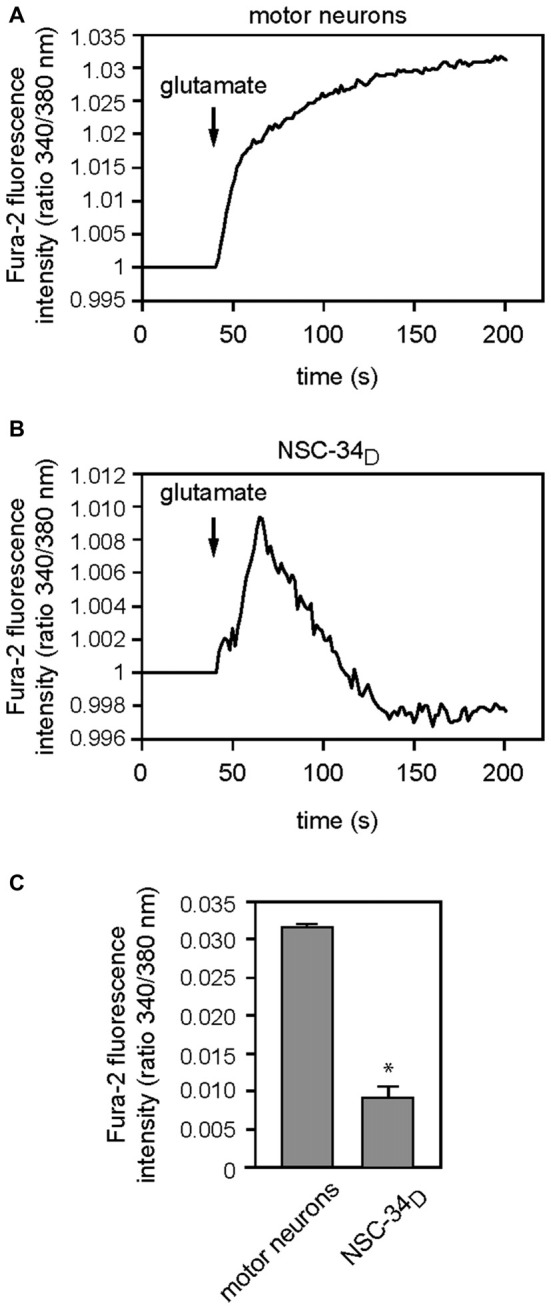
Acute effects of 100 μM and 1 mM glutamate (for primary MN and NSC-34D, respectively) for 200 s on calcium entry. Representative fluorescence measurement of Ca2+ entry in MN (A) and NSC-34D (B) after acute application of glutamate. Glutamate was added at the time indicated by the arrow. (A) Mean traces of cytosolic Ca2+ flux of MN and (B) NSC-34D in response to glutamate. (C) Histograms showing maximum fluorescence intensity following glutamate application in MN and NSC-34D. Mean data ± SEM from three coverslips per cell type with at least five cells per coverslip analyzed. *p < 0.001 (Mann-Whitney test MN vs. NSC-34D).
