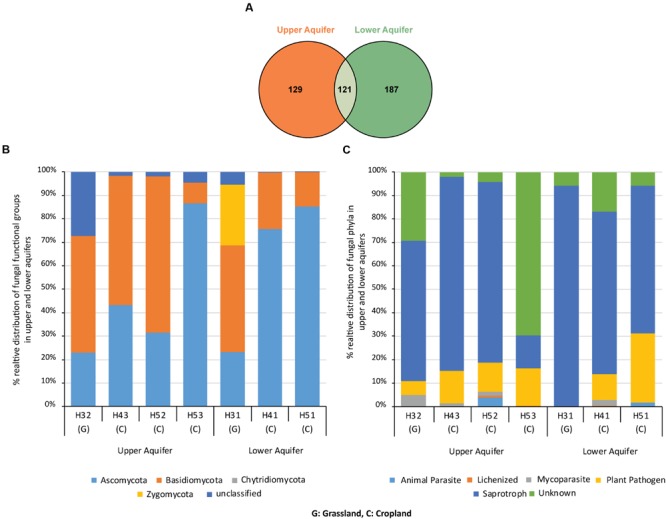
FIGURE 3.

Venn diagram (A) illustrating the number of fungal OTUs exclusively found in the upper and lower aquifer assemblages and OTUs that were found in both aquifers. Relative distribution of fungal phyla (B) and different fungal functional groups (C) found in upper and lower aquifer assemblages in the Hainich CZE.
