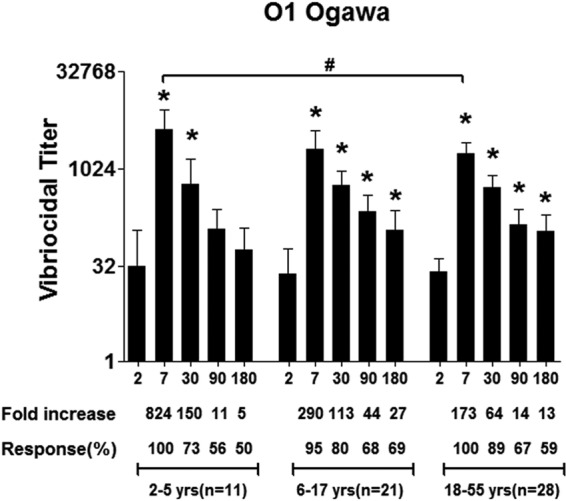
FIG 1.

Vibriocidal antibody responses in plasma in Bangladeshi cholera patients by age group. The columns indicate geometric mean reciprocal end titers, and error bars represent 95% confidence intervals. An asterisk denotes a statistically significant difference (P < 0.05) from the baseline (day 2) titer. Mean fold changes and responder frequencies are also shown. # indicates statistically significant differences between the study groups (P < 0.05). The x axis in all figures shows day of illness or convalescence.
