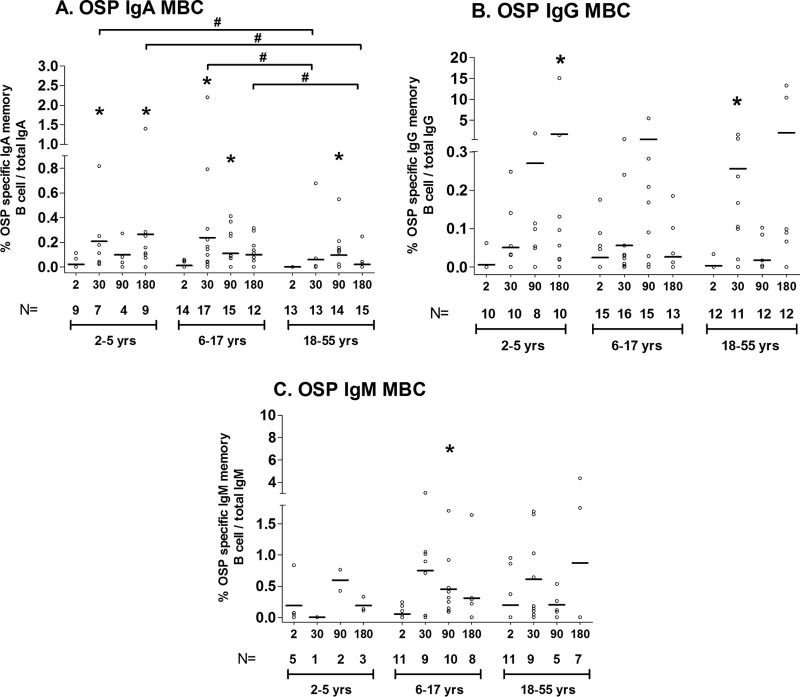
FIG 4.
Mean OSP-specific IgA, IgG, and IgM memory B cell responses by age group, as measured by ELISPOT, expressed as the percent antigen-specific responses of total isotype-specific memory B cells, with error bars representing standard errors of the means. An asterisk denotes a significant difference (P < 0.05) from the baseline (day 2). # indicates a statistically significant difference between the study groups (P < 0.05).

