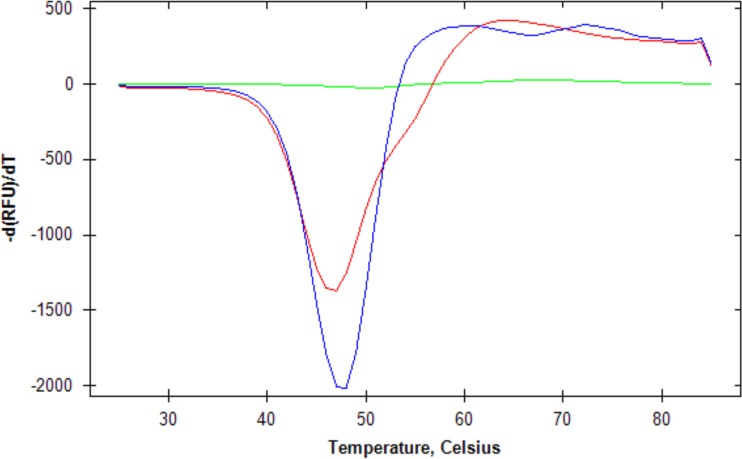
FIG 2.
Melting temperatures for wild-type rPA (blue), six-Asp mutant rPA (red), and dye only (green). The melting temperatures were determined as described in Materials and Methods. The graph shows the negative first derivative of the relative fluorescence units (RFUs) as a function of temperature. The minimum of each curve represents the melting temperature.

