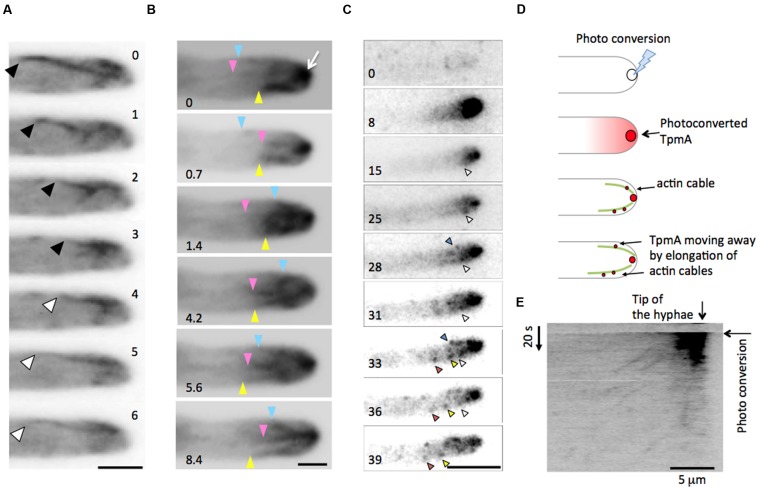
FIGURE 1.
Tropomyosin TpmA as a marker for dynamic actin cable. (A) Elongation and shrinkage of an actin cable visualized by GFP-TpmA. Wide-field image sequence of a dynamic actin cable at the hyphal tip of Aspergillus nidulans expressing GFP-TpmA. Black arrowheads indicate shrinkage of the actin cable, whereas white arrowheads indicate elongation of the actin cable. The elapsed time is given in seconds. Scale bar: 2 μm. (B) Three actin cables showed elongation and shrinkage in an independent manner. Blue, pink, and yellow arrowheads indicate the minus ends of the actin cables. The elapsed time is given in seconds. Scale bar: 1 μm. (C–E) Tracking TpmA within the actin cable visualized by using the photoconvertible fluorescent protein mEosFPthermo. (C) Image sequences of photoconverted mEosFPthermo-TpmA. Photoconversion was done at t = 7 s for the duration of 1 s. The differently colored arrowheads indicate the movement of mEosFPthermo-TpmA. The elapsed time is given in seconds. Scale bar: 5 μm. (D) Schematic representation of the pulse-chase experiment. mEosFPthermo-TpmA at the hyphal tip was photoconverted to its red form by focused 405-nm light. Actin cables are elongated at the plus end close to the plasma membrane by formin adding G-actin to the plus end. The photoconverted red signals moved away from the hyphal tip by elongation of actin cables at the plus end. (E) Kymograph from image sequences (C). The profile shows that photoconverted mEosFPthermo-TpmA moves linearly in time, which is indicative of the active elongation of an actin cable. Vertical scale: 20 s, horizontal scale bar: 5 μm.

