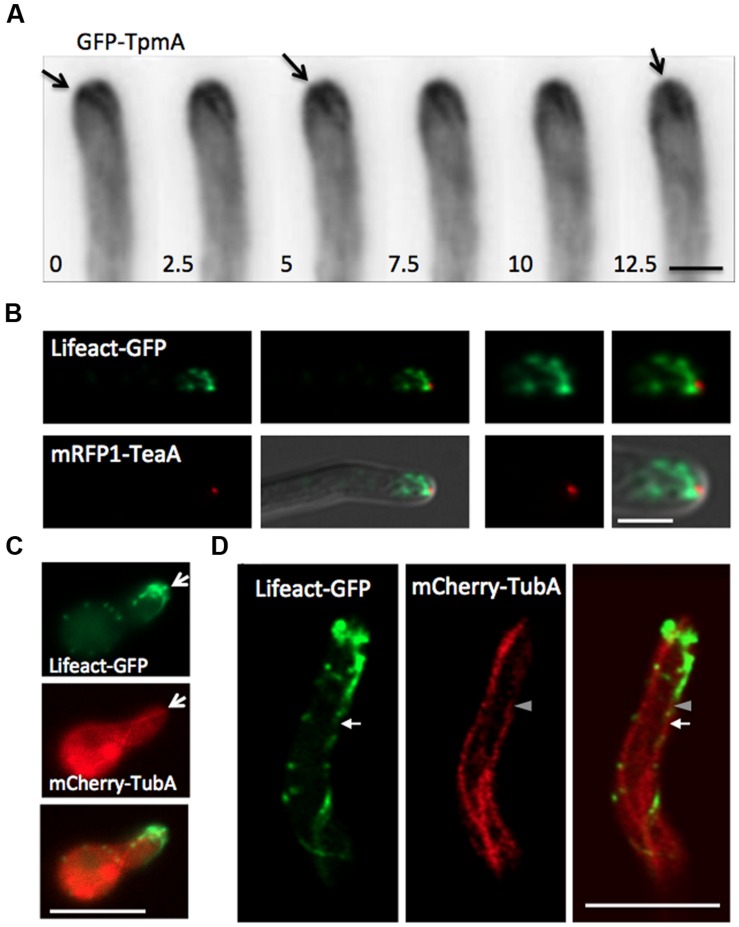
FIGURE 4.
Localization of actin cables with cell end marker or microtubules. (A) Wide-field image sequences of an actin cable by GFP-TpmA. The plus end, visualized by GFP-TpmA, moved along the apical membrane. Arrows indicate the plus end of the actin cable moving along the apical membrane. The elapsed time is given in seconds. Scale bar: 2 μm. (B) The strain expressing Lifeact-GFP under the alcA promoter and mRFP1-TeaA under the native promoter was grown in 2% glycerol containing medium. Scale bar: 2 μm. (C,D) Localization of actin cables by Lifeact-GFP and microtubules by mCherry-TubA. Super-resolution microscopy image was constructed by Airyscan (ZEISS; D). Scale bars: 2 μm.

