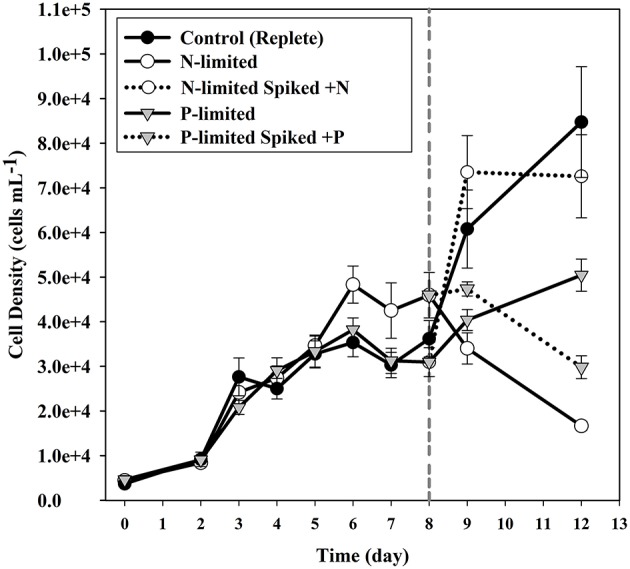
Figure 2.

Cell densities of cultures for each of the treatments. Error bars indicate one standard deviation. Solid circles indicate the replete (control) cultures. Open circles are used to plot the N-limited cultures, while triangles are used to plot the P-limited cultures. Dotted lines indicate the sub-cultures that were spiked with nutrients after sampling.
