
Figure 1.
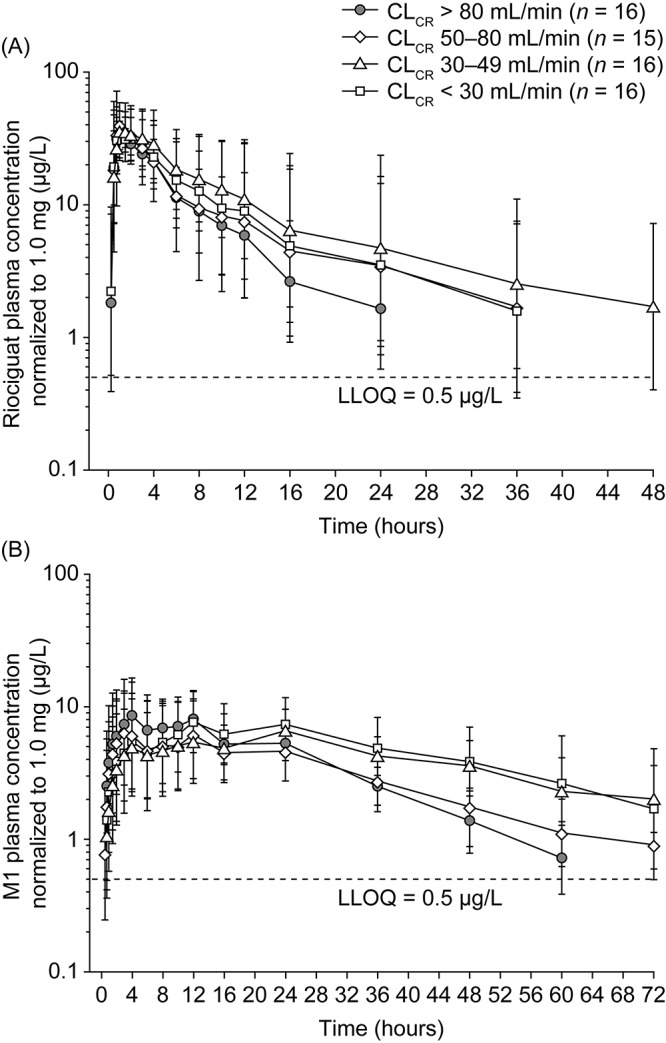
Geometric mean plasma concentration–time courses of total riociguat (A) and metabolite M1 (B) after a single oral dose of riociguat 1.0 mg in the mixed population (smokers and nonsmokers). In study I, individuals with severe renal impairment received riociguat 0.5 mg; plasma concentrations in these subjects were normalized to a 1.0-mg riociguat dose. Bars denote the geometric standard deviation; semilogarithmic scale, N = 63 (all individuals valid for pharmacokinetic evaluation). Individual data values below the LLOQ ceased to be measured. Mean values at any one time were calculated only if at least two-thirds of individual data were above the LLOQ. Values below the LLOQ were substituted with half of this limit for calculation of mean values. CLCR: creatinine clearance; LLOQ: lower limit of quantification.