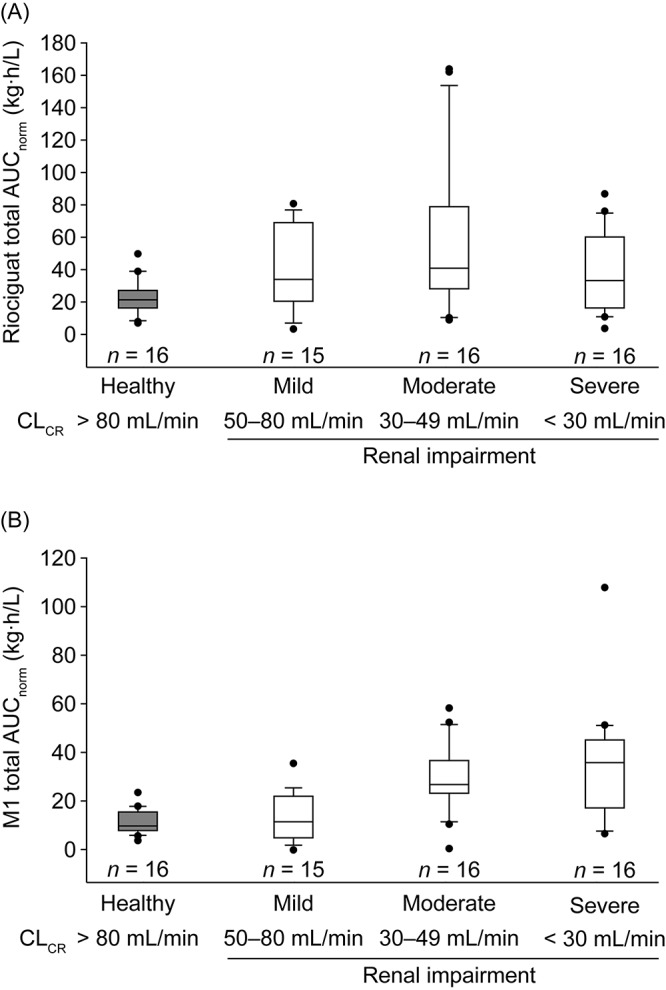
Figure 3.

Box-and-whisker plots of exposure to total riociguat (A) and metabolite M1 (B), normalized for riociguat dose and body weight, following a single oral dose of riociguat in a mixed population of smokers and nonsmokers (N = 63). In study I, individuals with severe renal impairment received riociguat 0.5 mg; all other participants in both studies received riociguat 1.0 mg. Boxes signify the twenty-fifth to seventy-fifth percentiles; vertical lines show the tenth to ninetieth percentiles; the horizontal bisecting line represents the median. More extreme values are plotted as points. AUCnorm: area under the plasma concentration–time curve from time 0 to infinity divided by dose of riociguat per kilogram of body weight for total riociguat; CLCR: creatinine clearance.
