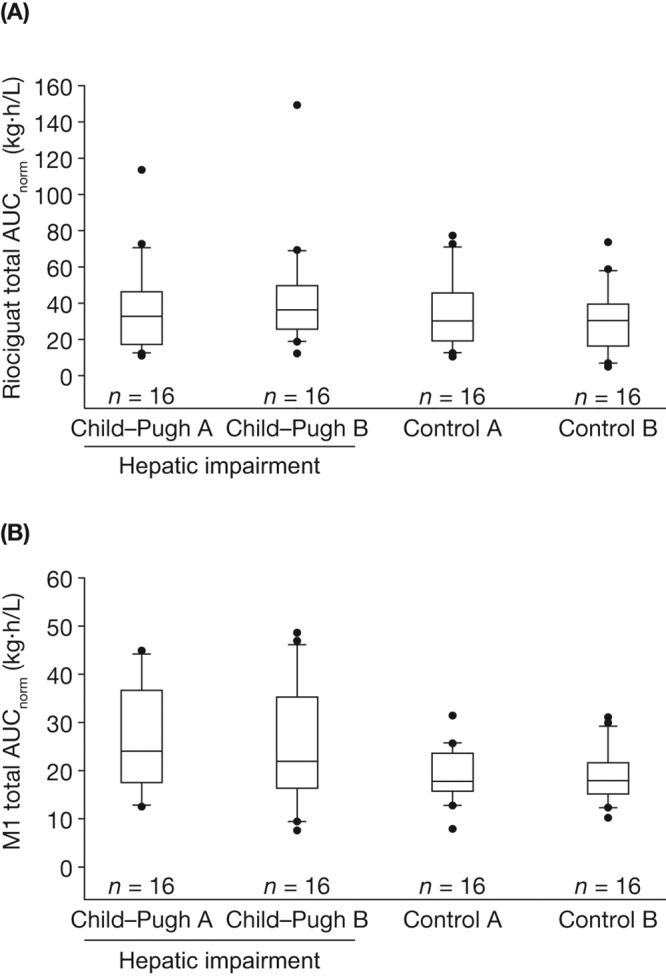
Figure 2.

Box-and-whisker plots of exposure to total riociguat (A) and metabolite M1 (B), normalized for riociguat dose and body weight (AUCnorm), following a single oral dose of riociguat 1.0 mg in a mixed population of smokers and nonsmokers (N = 64, all individuals eligible for pharmacokinetic evaluation). Study groups consisted of eligible participants with Child-Pugh A or B hepatic impairment and respective age-, weight-, and sex-matched healthy controls. Boxes signify the 25th to 75th percentiles, vertical lines show the 10th to 90th percentiles, and horizontal bisecting lines represent medians. More extreme values are plotted as points. AUCnorm, area under the plasma concentration–time curve from time 0 to infinity divided by dose of riociguat per kilogram of body weight for total riociguat.
