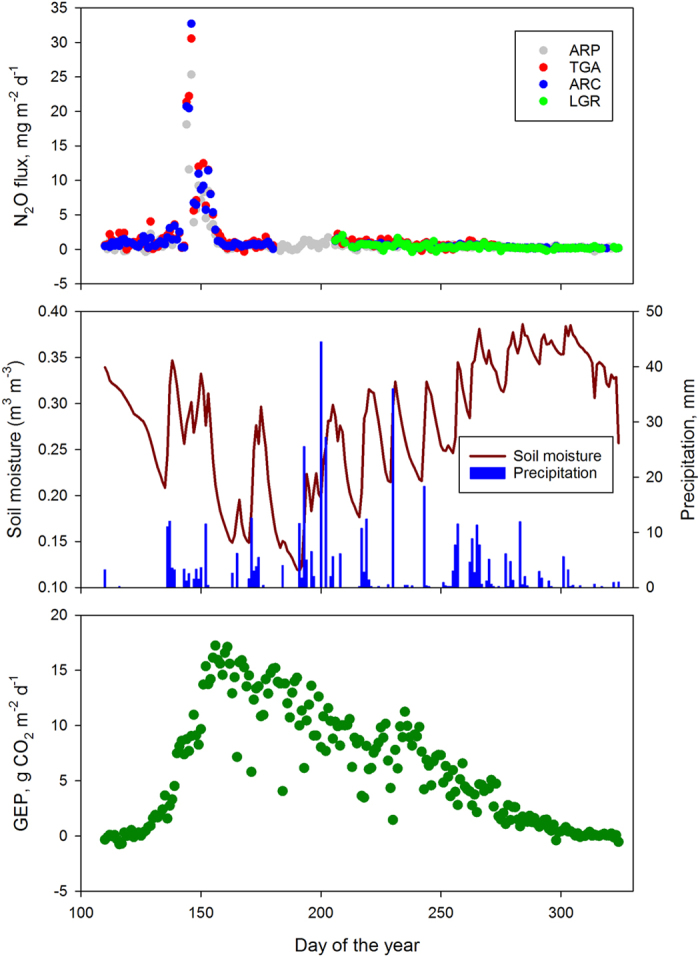
Figure 1.

Seasonal distribution of (A) daily averaged N2O emissions (mg m−2 d−1) as measured by 4 different laser based gas analysers (ARC – continuous wave laser spectrometer, Aerodyne Research Inc., Billerica, MA, USA; TGA – trace gas analyser, Campbell Scientific Inc., Logan, UT, USA; LGR - continuous wave laser spectrometer, Los Gatos Research Inc., Mountain View, CA, USA; ARP – pulsed quantum cascade laser spectrometer, Aerodyne Research Inc., Billerica, MA, USA) (B) daily averaged volumetric soil moisture content (m3 m−3) measured at 2.5 cm below the soil surface and daily sum of precipitation (mm) and (C) daily sums of gross ecosystem productivity (GEP, g C m−2 d−1) during the N2O instrument inter-comparison organised during April – November 2011 at a mineral soil site at Maaninka in eastern Finland. The site was cultivated with reed canary grass (RCG, Phalaris arundinaceae, L.), a perennial bioenergy crop.
