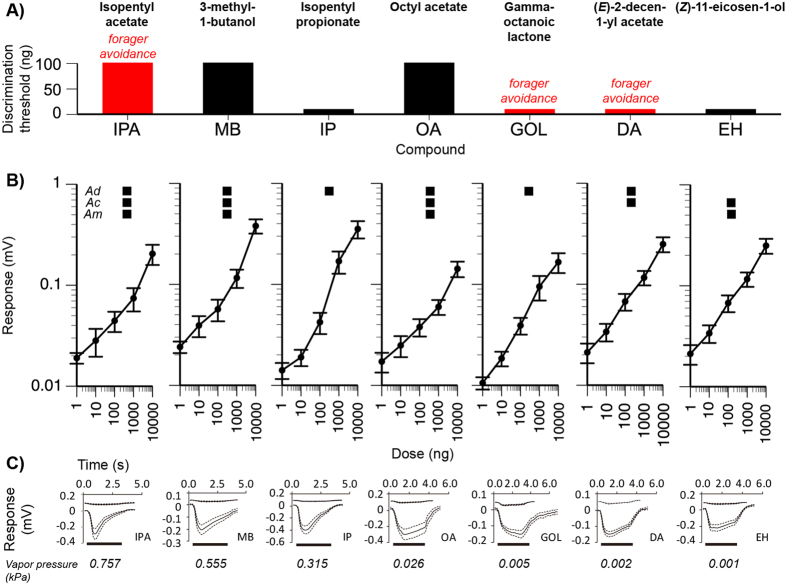
Figure 3. Antennal responses of A. cerana foragers to pure compounds found in sting gland pheromones.
(A) The antennal discrimination threshold for each compound (lower value = greater sensitivity). Compounds that elicited forager avoidance (see Fig. 1) are indicated in red. (B) The dose-response curve (mean and standard errors, SE) for each compound. The bee species (A. dorsata = Ad, A. cerana = Ac, and A. mellifera = Am) corresponding to these compounds are indicated. (C) Average EAG response curves calculated from all responses to 10,000 ng of the tested compound. Mean responses (solid line) with SE (dashed lines) are shown. The horizontal bar indicates the stimulus duration. Control responses (mean and SE) are shown above the response to each compound.

