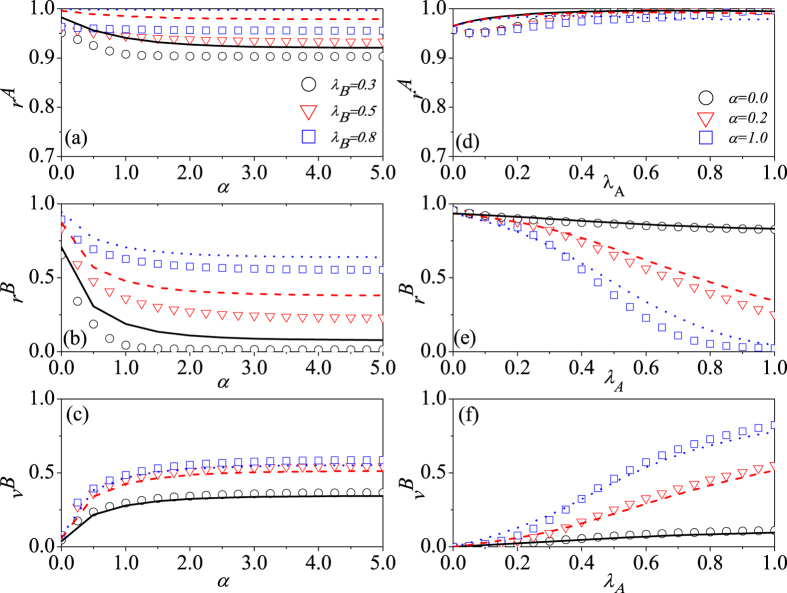
Figure 3. The impacts of social reinforcement effect and information transmission rate on final states.
For SF-ER double-layer network, subfigures (a–c) show the values of rA, rB and vB as a function of α with different values of λB (0.3, 0.5, and 0.8), and their analytical predictions are corresponded to the black solid, red dashed, and blue doted lines, respectively. Where λA is set as 0.5. Subfigures (d–f) illustrate the values of rA, rB and vB versus the parameter λA for different values of α (0, 0.2, and 1.0), corresponding to the black solid, red dashed, and blue doted lines respectively. When λB is fixed at 0.5.

