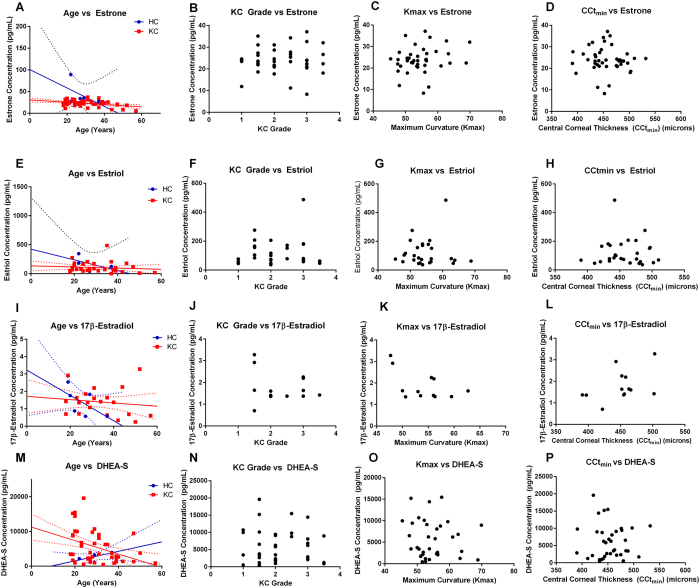
Figure 3. Hormone levels relative to clinical presentation characterized by KC grade, central corneal thickness (CCtmin), maximum curvature (Kmax), and in Keratoconus (KC) patients compared to healthy controls (HC).
(A–D) Estrone, (E–H) estriol, (I–L) 17β-estradiol, and (M–P) DHEA-S levels plotted relative to age at time of collection, clinical severity (KC grade), maximum curvature (Kmax), and minimum central corneal thickness (CCtmin) measured in microns. For each patient, the eye with the most severe KC clinical features was plotted versus hormone concentration. (A,E,I,M) Best-fit linear curve for age-dependence of hormone concentrations shown with solid lines and the 90% confidence interval with dotted lines (HC in blue and KC in red).

