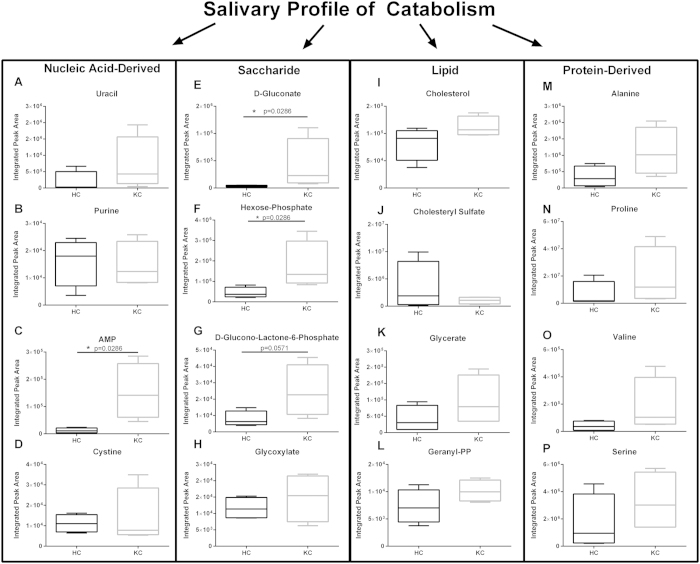
Figure 5. Salivary profile of the major classes of biomolecules measured in healthy controls (HC) and Keratoconus (KC) patients.
(A–D) Nucleic acid-derived, (E–H) saccharide-derived, (I–L) lipid-derived, and (M–P) protein-derived metabolites were measured by LC/MS-MS. Significantly elevated AMP and D-glucono-lactone-6-phosphate were measured in KC saliva samples compared to HCs. n = 4, with each n representing a different patient. The boxplot representation depicts the central rectangle spanning the interquartile range with a line showing the median. Whiskers above and below the central box represent the maximum and minimum data points, respectively. Statistical analysis was performed using a Mann-Whitney two-tailed T-test with p ≤ 0.05 considered statistically significant.

