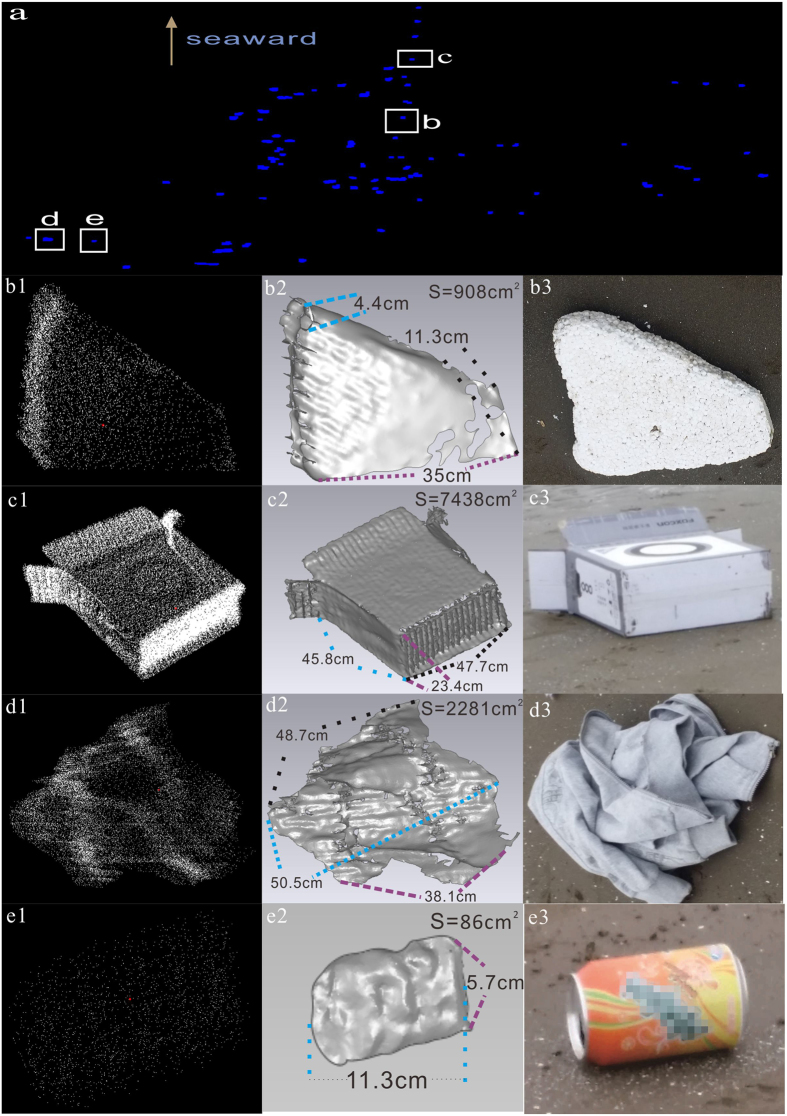
Figure 4. Distribution and reconstruction of debris in the simulated experiment at Nanhui beach.
(a) Distribution of identified debris on the beach. The boxes (b–e) represent plastic (b1–b3), paper (c1–c3), cloth (d1–d3) and metal (e1–e3). (b–e1), point-clouds of individual debris; (b–e2), 3D models of individual debris; S is the surface area of the debris, and the distance between two points is the curve length on the surface; (b–e3), photos of real objects. The figure was created in Geomagic Studio 2013 and CorelDRAW Graphics Suite X5.

