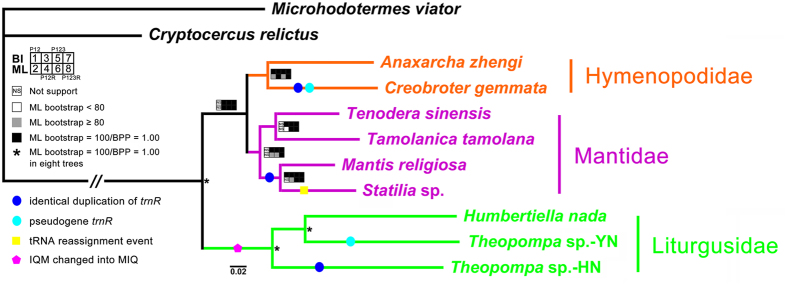
Figure 4. Phylogenetic relationship among nine praying mantises inferred from mitogenome data using BI and ML analyses.
Asterisk indicate Bayesian posterior probabilities (BPP) = 1.00 and ML bootstrap = 100 in all Phylogenetic analysis. Squares at the nodes correspond to BPP for 1 (PCG12), 3 (PCG12R), 5 (PCG123), and 7 (PCG123R) and ML bootstrap support values in percentages for 2 (PCG12), 4 (PCG12R), 6 (PCG123) and 8 (PCG123R). NS: not support; white square: ML bootstrap values <80; gray square: ML bootstrap values ≥80; black square: ML bootstrap values = 100 and BPP = 1.00.

