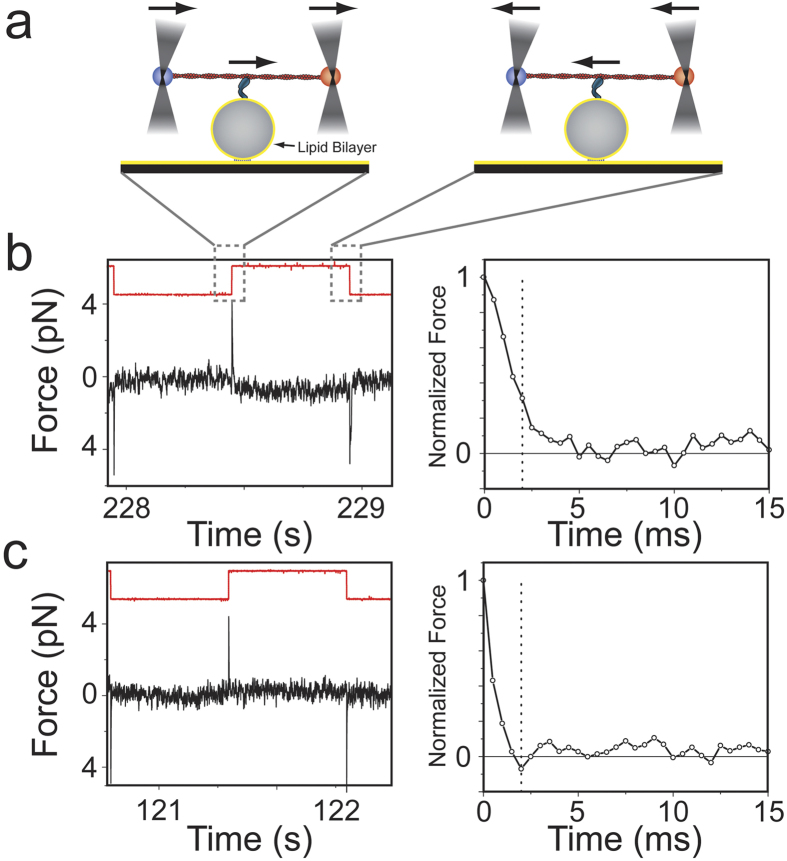
Figure 1. Relaxation of the force on an actin dumbbell held by optical traps undergoing a square wave oscillation.
(a) Cartoon representation of the three-bead geometry. An actin filament held by two laser-trapped beads is oscillated over a spherical lipid coated pedestal while attached to Myo1c. (b), Left): Sample of the force trace for one of the two laser-trapped beads (black) and the square wave pulse (red; arbitrary units) which is applied to the laser traps, in the presence of 0.6 pM Myo1c and 1 μM ATP. The force offset due to pretention of the actin dumbbell (Methods) has been removed for the sake of clarity. (b), Right): Expanded view of the relaxation phase for a force spike from the left panel after normalization. The dashed vertical line indicates the 5th point (2 ms) up to which the S5 value is calculated and is used as a first approximation of the rate of force relaxation (see text for details). (c) The same as in (b) but in the absence of Myo1c. (When the actin dumbbell is away from a lipid coated spherical pedestal data traces are similar to (c) and are therefore not presented here for this reason).

