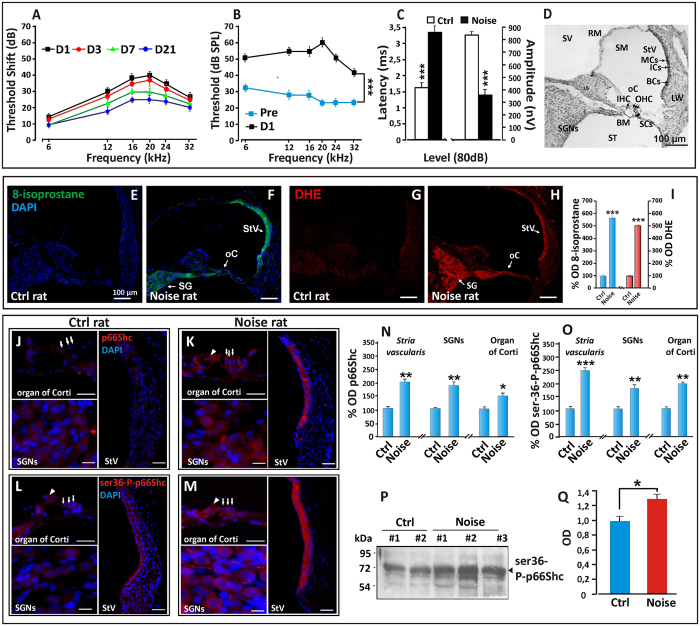
Figure 1. Noise-Induced hearing loss is accompanied by oxidative stress and by activation of p66shc in the rat cochlea.
(A) ABR averaged threshold shift values (±SEM) in the Noise group (n = 6 rats) showing the greatest hearing loss at day 1 (12–20 kHz) and a residual defect (~25 dB) at day 21. (B) Compared threshold values before and at day 1 post-noise. (C) Latency and amplitude of P1 wave (16 kHz, 80 dB) at day 1 post-noise. (D) representative H&E-stained cryosection displaying the main structures and cell types of the rat cochlea (middle turn). (E–H) representative confocal images of 12 μm-thick rat cochlea cryosections (12 μm), showing enhanced 8-isoprostane (F) and DHE (H) fluorescent signals in oC, SG and StV. Fluorescence accumulation indicates increased lipid peroxidation and super-oxide production at day 1 after noise exposure (compare: E–G with F–H). (I) quantification of fluorescence signal for 8-isoprostane (blue columns) and DHE (red columns) measured by optical density (data are normalized to control). Pictures are representative of two/three sections from each of 5 animals/group (right cochleae used for 8-isoprostane; left cochleae for DHE staining). (J–Q) The acoustic trauma induces p66shc protein and its ser36 phosphorylated form. (J–M) Increased expression of p66shc (compare J with K) and of its phosphorylated form ser36-P-p66shc (compare L with M). Pictures are representative of 2–3 sections from each of 5 animals per group (right cochleae: p66shc; left cochleae: ser36-P-p66shc). (N–O) immunofluorescence analysis of total p66shc and ser36-P-p66shc, respectively. (P) Anti ser36-P-p66 immunoblot analysis of total cochlear homogenates from control and noise-exposed rats. Relevant bands are indicated by arrowhead. (Q) ser36-P-p-66shc band densitometric quantitation confirming increased phosphorylation signal in the Noise group. Values are mean ± SD of 2 controls (Ctrl) and 3 trauma-exposed (Noise) samples. Blot representative of two/three independent experiments. Statistics: (B,C,I) by two-way ANOVA (***p < 0.0001); (N,O) by one-way ANOVA and Q by two-tailed t-test (*p < 0.05; **p < 0.001; ***p < 0.0001). Scale bar: (E–H) 100 μm; (J–M) organ of Corti 30 μm, StV 50 μm, SGNs 15 μm. SV: scala vestibuli, RM: Reissner membrane, SM: scala media, MCs: marginal cells, ICs: intermediate cells, BCs: basal cells, LW: lateral wall, StV: stria vascularis, oC: organ of Corti, SGNs: spiral ganglion neurons, SCs: supporting cells, BM: basilar membrane, OHC: outer hair cells, IHC: inner hair cells, ST: scala tympani, LB: limbus.

