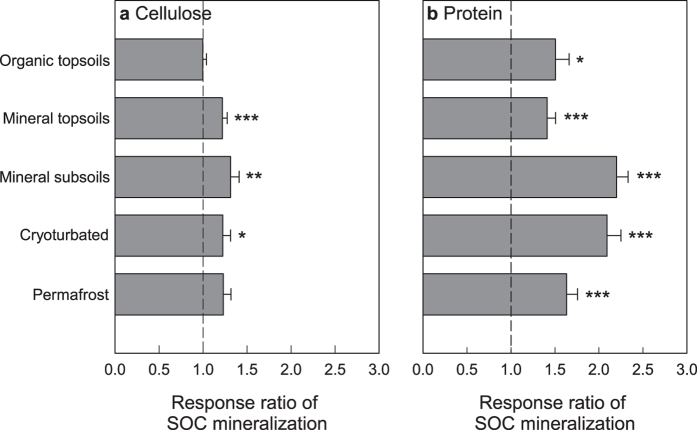
Figure 3. Response of cumulative SOC mineralization in different horizons of arctic permafrost soils to addition of cellulose or protein.
Response ratios were calculated as ratios of samples amended with cellulose or protein over control samples. Bars represent means with standard errors, significant differences in SOC mineralization between amended and control samples are indicated (Welch’s paired t-tests; ***p < 0.001; **p < 0.01; *p < 0.05). For response ratios at individual sampling sites see Supplementary Table S5.

