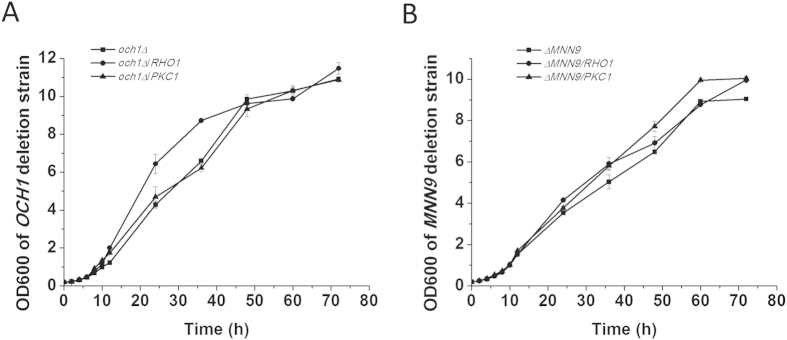
Figure 7. The growth curve of the RHO1- and PKC1-expressing strains.
(A) The growth curve of the OCH1 deletion strain expressing RHO1 and PKC1. (B) The growth curve of the MNN9 deletion strain expressing RHO1 and PKC1. The data are presented as the means ± standard errors from three independent experiments.

