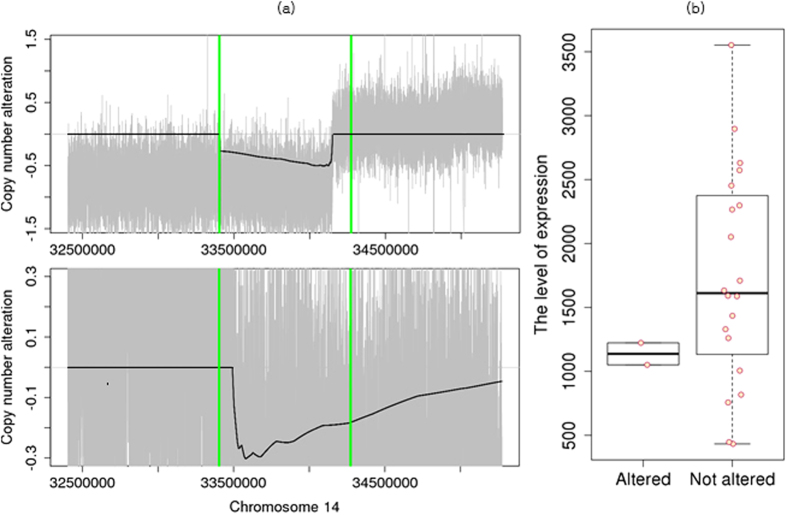
Figure 4. Copy number deletions in NPAS3.
(a) Individual profiles of two samples that have copy number deletions. Gray signals represent log2 ratios of the copy numbers, and the black line represents  signals. NPAS3 is located between green vertical bars. (b) Boxplots of expression levels of samples with NPAS3 deletion and samples without copy number changes.

