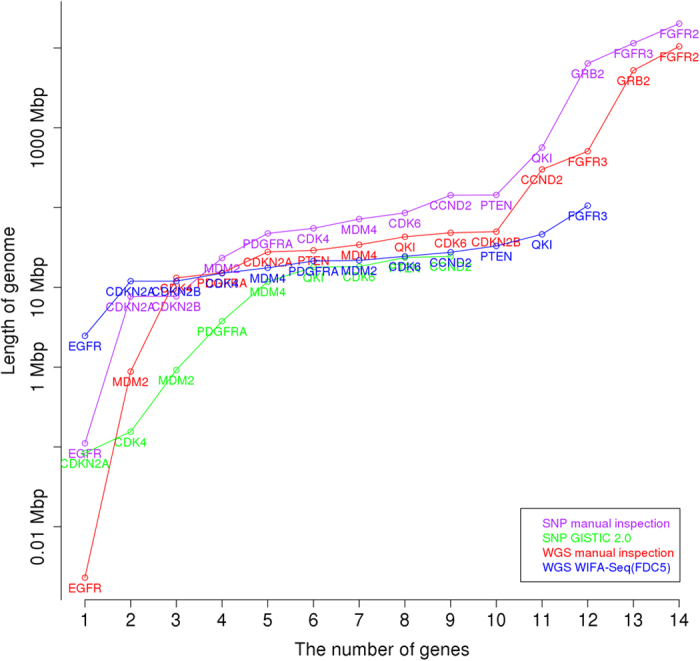
Figure 7. Comparison between the SNP array and WGS in GBM.

The x-axis represents the number of known GBM silver standard genes for the SNP array and WGS, and the y-axis represents the length of the genomes for identifying these genes. Manual inspection and GISTIC 2.0 for the SNP array, and manual inspection and WIFA-Seq for WGS were compared.
