Figure 1.
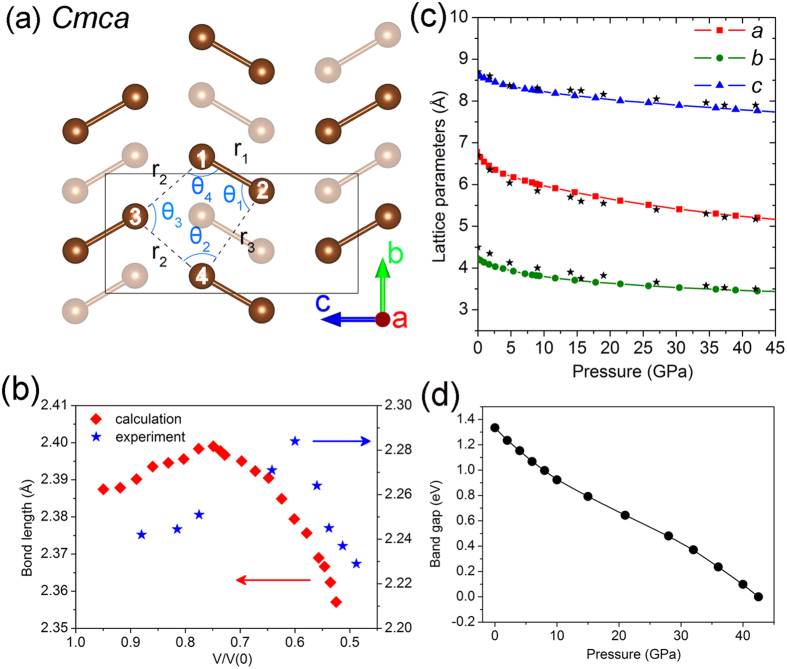
(a) The Cmca structure of Br2. The light colored atoms are in the second layer. r1, r2 and r3 represent the intramolecular bond length, first neighbor intermolecular distance and second neighbor intermolecular distance, respectively. (b) Bond length evolution comparison between calculated result from PBE-D2 method (red square) and experiment result (blue star). V is the cell volume and the reference V(0) is the volume at ambient pressure in experiment (see text). (c) The calculated and experimental lattice parameters evolution under pressure. The colored dots and the black stars represent the calculated and experimental results, respectively. The experimental values are from ref.9.(d) Calculated pressure dependence of the band gap energy using PBE+ D2 method for Cmca bromine phase. The solid line is the guide for eye.

