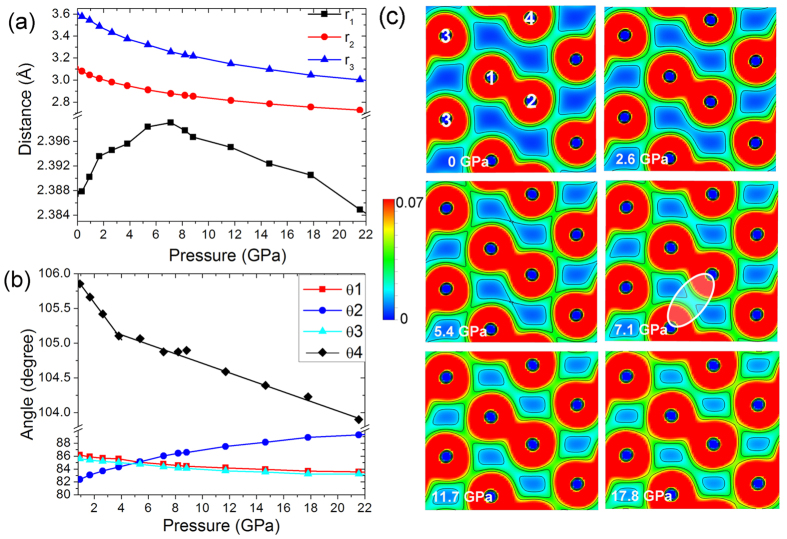
Figure 2.
(a) Evolution of intermolecular distances under pressure in the Cmca structure. (b) Intermolecular angles under pressure. The labels for the distance and angle are illustrated in Fig. 1a. (c) 2D charge density plots of the bromine Cmca structure at selected pressures. The unit of the charge density is e/cell. The emergence of the second intermolecular interaction is highlighted with a white ellipse.

