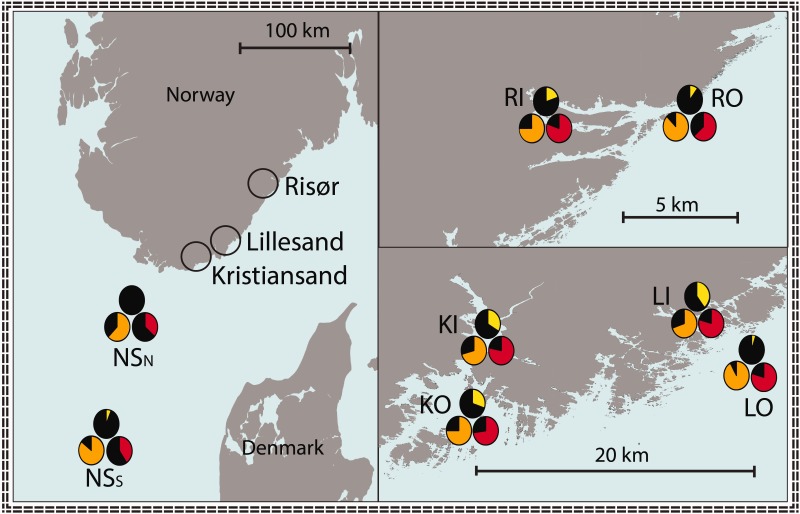
Fig. 4.—
Distribution of rearranged chromosomes in the North sea—Skagerrak study area. Frequencies of rearranged chromosomes (allele II) are presented as pie charts for each sampling location, where linkage group 2, 7, and 12 are indicated in yellow, orange, and red, respectively. Left; North sea North (NSN) and North sea South (NSS). Right; the three coastal locations Kristiansand, Lillesand, and Risør, each containing an inner-coast and an associated outer-coast sampling site.

