
Figure 3.
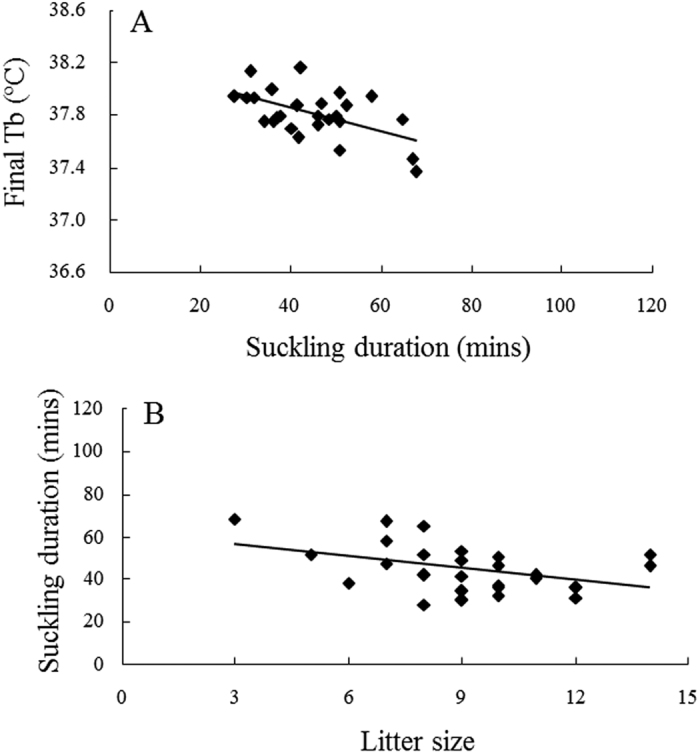
The relationships between nursing duration and final body temperature (A), litter size (B) and litter mass (C) at peak lactation (DOL 11–15, n = 26). Regressions are described by A: y = −0.0091x + 38.215, B: y = −0.0091x + 38.215 and C: y = −0.3793x + 71.314.