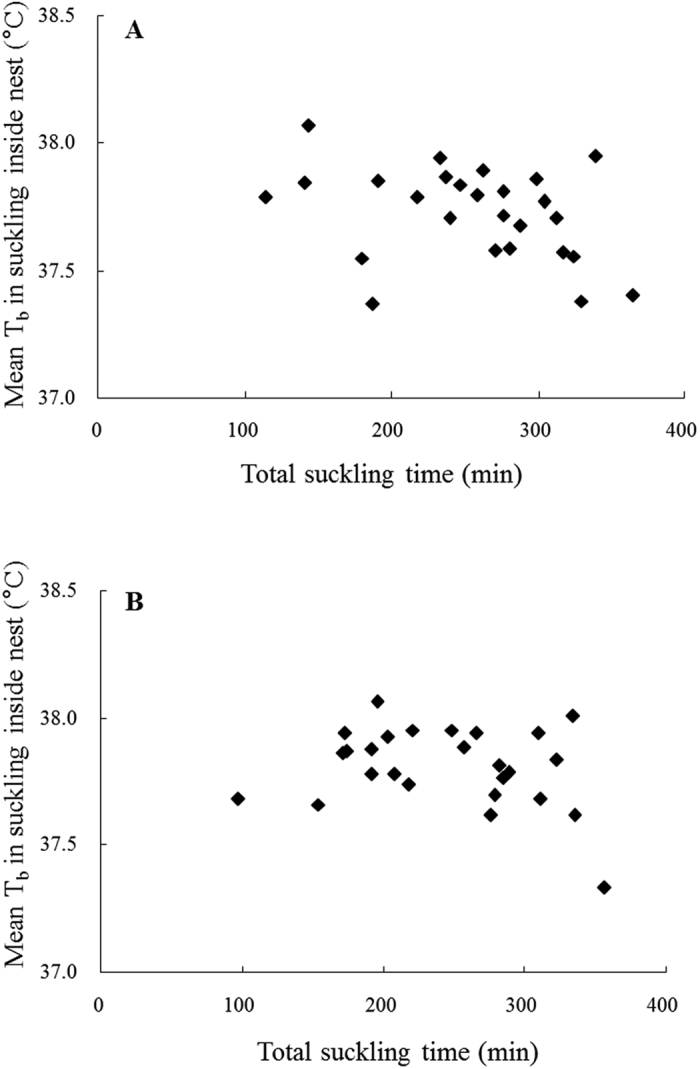
Figure 4. Relationship between mean nursing Tb and total time spent nursing inside the nest (n = 26).

(A) represents means over the whole lactation (DOL 2–20), and (B) represents means over the peak lactation (DOL 11–15). The regressions are described by y = −0.001x + 37.973 (A) and y = −0.0006x + 37.946 (B) and were not significant p > 0.05.
