
Figure 7. The relation between litter size and maternal body temperature during nursing inside nest.
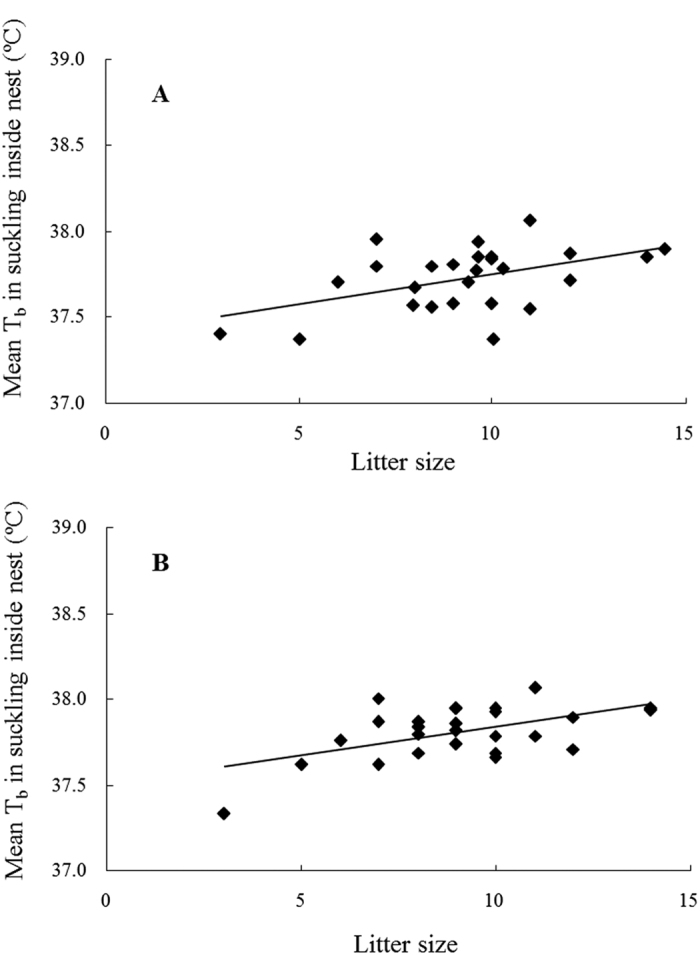
(A) represents means over the whole lactation (DOL 2–20) (y = 0.0344x + 37.403, R2 = 0.225, F1,24 = 6.988, P = 0.014), and (B) represents means over the period of peak lactation (DOL 11–15) (y = 0.0335x + 37.502, R2 = 0.296, F1,24 = 10.09, P = 0.004).