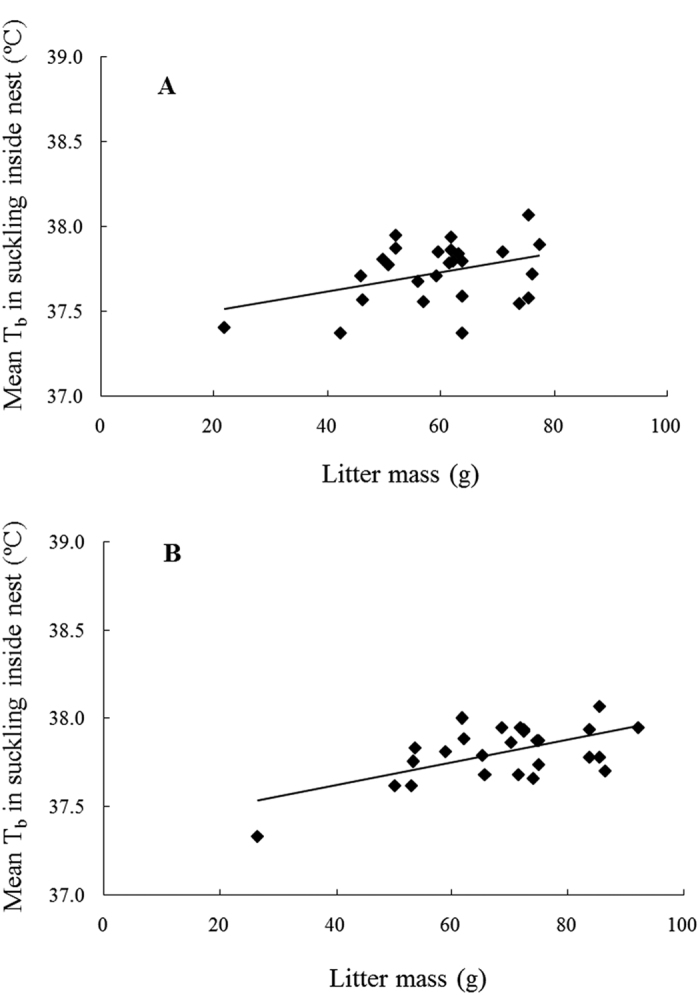
Figure 8. The effect of litter mass on maternal body temperature during nursing inside nest.

(A) represents means over the whole lactation (DOL 2–20) (y = 0.0056x + 37.39, R2 = 0.1486, F1,24 = 4.166, P = 0.052), and (B) represents means over the peak lactation (DOL 11–15) (y = 0.0064x + 37.366, R2 = 0.347, F1,24 = 12.66, P = 0.002). The sample sizes (n) are 26 mice in the both figures. When the smallest litter size (=3) was removed (n = 25 mice), the regressions changed to A: y = 0.0049x + 37.465, R2 = 0.065, F1,23 = 1.603, P = 0.218 and B: y = 0.0036x + 37.572, R2 = 0.065, F1,23 = 2.939, P = 0.1.
