
Figure 4. H-SN1 inhibits TNF-α-induced NF-κB and MAPK signaling activation.
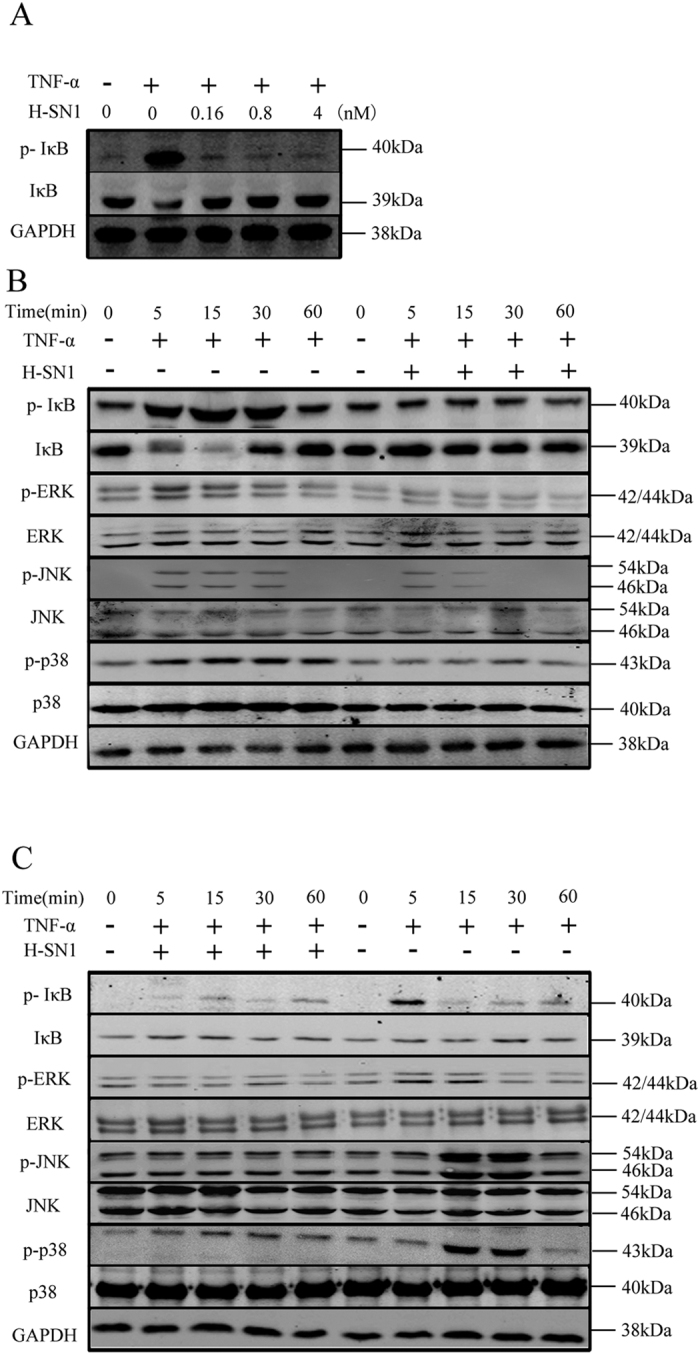
(A) HT-29 cells were treated with 20 ng/ml TNF-α for 10 min in the presence of various concentrations of H-SN1 (0.16, 0.8, and 4 nM). TNF-α was added to HEK293 cells (B) and HT-29 cells (C) in the presence or absence of 4 nM H-SN1 for different times. Original blots are shown in Supplementary Fig. S1; the gels were run under the same experimental conditions.