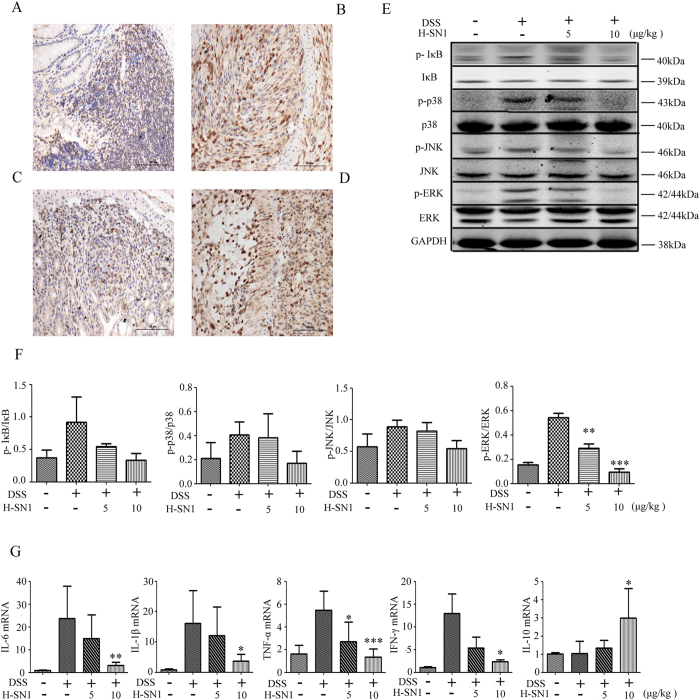
Figure 6. H-SN1 reduces TNF/TNFR1 axis downstream targets at both the gene and protein levels.
H-SN1 effect on TNF-α expression in the colonic tissue in (A) Normal; (B) DSS; and (C,D) DSS + H-SN1, 10 and 5 μg/kg groups, respectively. H-SN1 effect on TNF-α induced the activation of NF-κB and MAPK in the colon of mice suffering from colitis. (E) Western blot analysis. (F) ImageJ software was used to quantify the levels of protein phosphorylation. (G) Impact of H-SN1 on the mRNA expression of inflammatory factors including IL-6, IL-1β, TNF-α, INFγ, and IL-10. Values represent the means ± SEM,*p < 0.05, **p < 0.01, ***p < 0.001 for DSS + H-SN1 compared with DSS + vehicle. Original blots are shown in Supplementary Fig. S2; the gels were run under the same experimental conditions.

