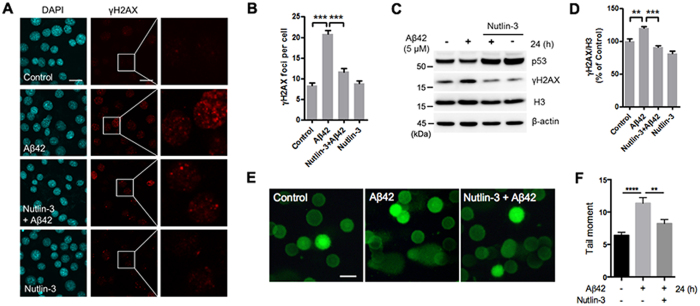
Figure 6. Effect of Nutlin-3 on Aβ42-induced DNA damage.
HT22 cells were treated with Aβ42, Nutlin-3 or Aβ42 + Nutlin-3 for 24 h. Nutlin-3 inhibited the level of γH2AX increased by Aβ42. (A) Representative images of γH2AX (red) stained cells. DAPI (blue) was used as a nuclear marker. Right column is an enlargement of the boxed area in the γH2AX staining images. Scale bar: 20 μm. (B) Quantification of γH2AX foci per cell detected in (A). The number of γH2AX foci was counted in 240 cells per each condition. Statistical significance was tested by one-way ANOVA followed by a Tukey’s multiple comparison test. ***P < 0.001. (C) Representative image of western blots for p53 and γH2AX. (D) Quantification of γH2AX levels. The level of γH2AX was quantified by densitometry and normalized to histone H3. Statistical significance was tested by one-way ANOVA followed by a Tukey’s multiple comparison test (n = 4, **P < 0.01, ***P < 0.001). All the gels were run under same experimental conditions. Full-length images are presented in the supplementary information. (E) Representative alkaline comet assay image. DNA damage was assessed using an alkaline comet assay in HT22 cells. DNA was labeled with SYBR green dye. Scale bar: 100 μm. (F) The comet tail moments were analyzed from at least 100 cells in each sample using Comet Assay IV software. Statistical significance was tested by one-way ANOVA followed by a Tukey’s multiple comparison test. ****P < 0.0001, **P < 0.01.

