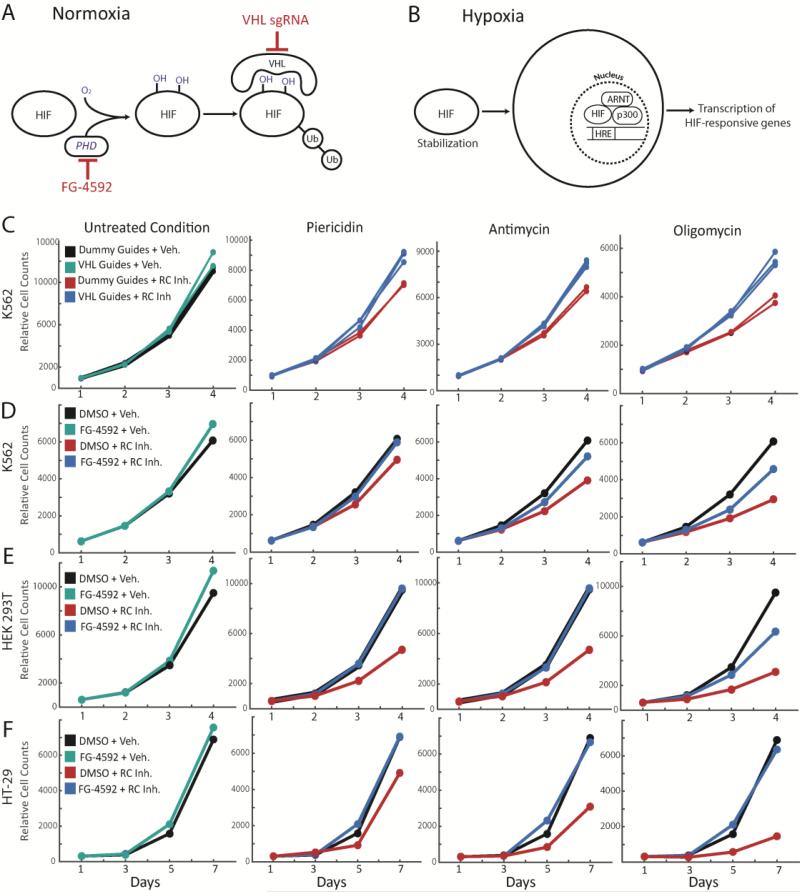
Figure 2. Genetic or small molecule activation of the HIF response is protective against multiple forms of RC inhibition, in multiple cell types.
(A) Schematic for HIF degradation during normoxia. (B) Schematic for induction of hypoxia transcriptional program during hypoxia. (C) Growth curves for K562 VHL-knockout cells (cyan, blue) or non-targeting sgRNA cells (black, red) for untreated or disease conditions (mean shown). Disease conditions correspond to inhibition of Complex I (piericidin), Complex III (antimycin) or Complex V (oligomycin). Growth curves for (D) K562 cells, (E) HEK293T cells and (F) HT-29 cells ± FG-4592, in combination with untreated or disease conditions (inhibition of complex I, III and V). All time points were measured in duplicate and all growth curves are representative of 2-3 independent experiments (mean shown). All final cell counts of FG-treated rescue (or VHL-KO rescue in 2A) in presence of RC inhibitor were statistically significant (one-sided t-test p-value < 0.05).

