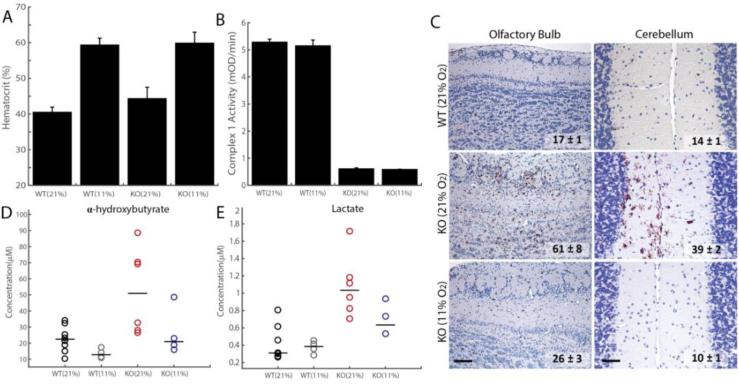
Figure 6. Hypoxia exposure of Ndufs4 KO mice alleviates metabolic disease markers, as well as neuropathology, without rescuing Complex I activity.
(A) Hematocrit values for WT and KO mice treated with normoxia or hypoxia for ~3 weeks (n = 3-4 per group, test p-value < 0.05 for normoxia vs. hypoxia for both WT and KO). (B) Complex I Activity is significantly reduced in KO mice relative to WT mice, in both normoxic and hypoxic conditions (n = 3-4 per group, t-test p-value < 0.01). (C) Representative images for immunostaining against the inflammatory marker, Iba-1, in the olfactory bulb and cerebellum of Ndufs4 KO mice treated with hypoxia or normoxia and WT mice exposed to normoxia breathing. The number of Iba-1 positive cells per 10 random fields of view shown for each treatment group (Mean ± S.E., t-test p-value < 0.01 for normoxic vs. hypoxic KO, n = 3-4 per group). Scale bar is 200 microns for OB and 50 microns for cerebellum. (D) Plasma α-HB levels in WT and KO mice, exposed to hypoxia or normoxia (n = 4-8 per group). Median shown as horizontal bar. (E) Plasma lactate in WT and KO mice, exposed to hypoxia or normoxia (n = 4-8 per group). Median shown as horizontal bar.

